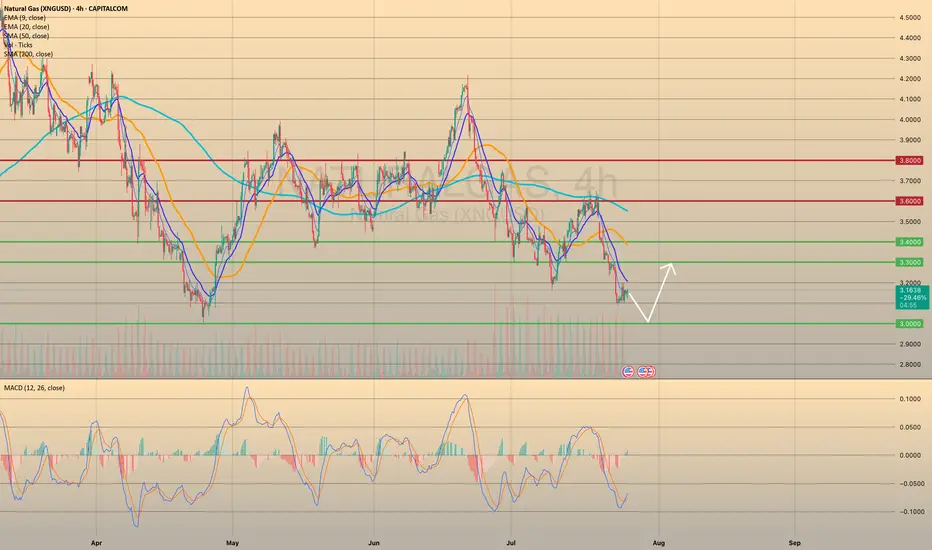
XNGUSD CONTINUES ITS DOWNWARD TREND. FOR HOW LONG?XNGUSD CONTINUES ITS DOWNWARD TREND. FOR HOW LONG?
Recent bearish impulse started at the beginning of this week may come to an end soon. Yesterday the U.S. Natural Gas Storage report came out. Numbers appeared to be lower than expected and lower than previous. (23b vs 28b vs 46b). This is bullish s
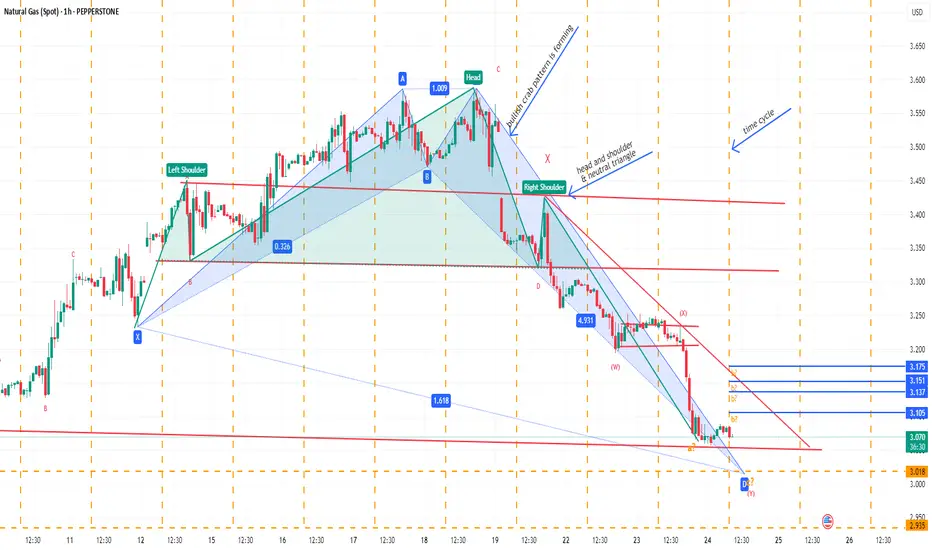
Natural gas spotHead and shoulder pattern observed and neo wave wise also appear either neutral triangle , if break neck line good fall and then near another bigger head and shoulder neckline. Let see

Natural Gas Price Drops by 7%Natural Gas Price Drops by 7%
As the XNG/USD chart shows today, natural gas is trading around $3.333/MMBtu, although yesterday morning the price was approximately 7% higher.
According to Reuters, the decline in gas prices is driven by:
→ Record-high production levels. LSEG reported that averag

Natural Gas is in the Buying DirectionHello Traders
In This Chart NATGAS HOURLY Forex Forecast By FOREX PLANET
today NATGAS analysis 👆
🟢This Chart includes_ (NATGAS market update)
🟢What is The Next Opportunity on NATGAS Market
🟢how to Enter to the Valid Entry With Assurance Profit
This CHART is For Trader's that Want to Improve Their Te
XNGUSD Technical Update – What the Chart Is Telling Us NowIn this video, I break down the current XNGUSD (Natural Gas) chart using pure price action analysis on the daily timeframe.
This update builds on my previous post, where I shared a comprehensive outlook supported by fundamentals, including supply/demand imbalances, geopolitical risks, and long-term


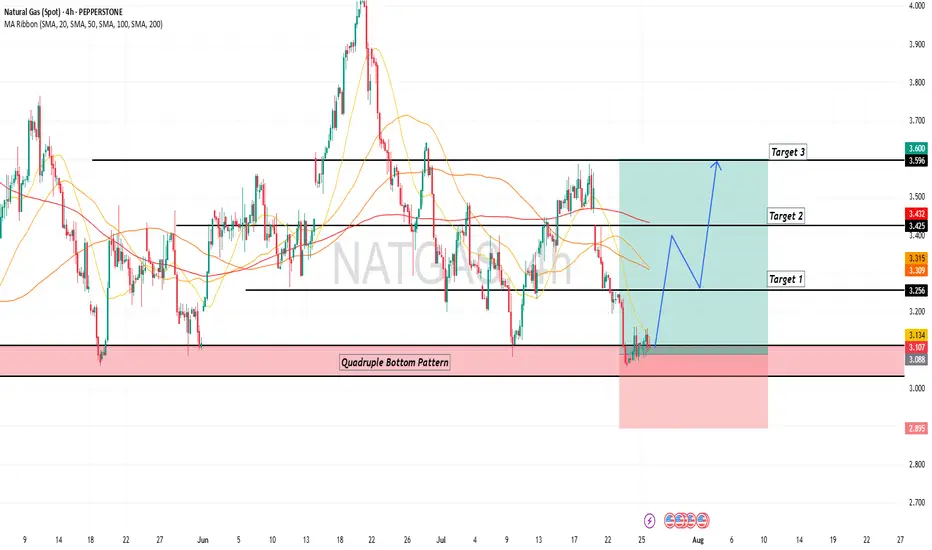
NATGAS Long Setup – Accumulation + Breakout OpportunityInstrument: US Natural Gas (Spot)
Timeframe: 1D
Published: July 24, 2025
By: @Rendon
📈 Idea Summary:
Natural gas is showing signs of accumulation after a corrective downtrend. Price recently tested key horizontal support around $2.96–$2.85 and is now attempting a recovery. Two potential bullish sce

NATURAL GAS SPOTBullish crab pattern may form, if another harmonic pattern may develop later.
Neo wave wise may be in wave Z need confirmation.
Time cycle high low break may be trend continue in break out/down direction.
Not sebi research analyst.
Triple Bottom @ Natural GasNaturalgas is near triple bottom
Best level for accumulation
Pure price action 💯

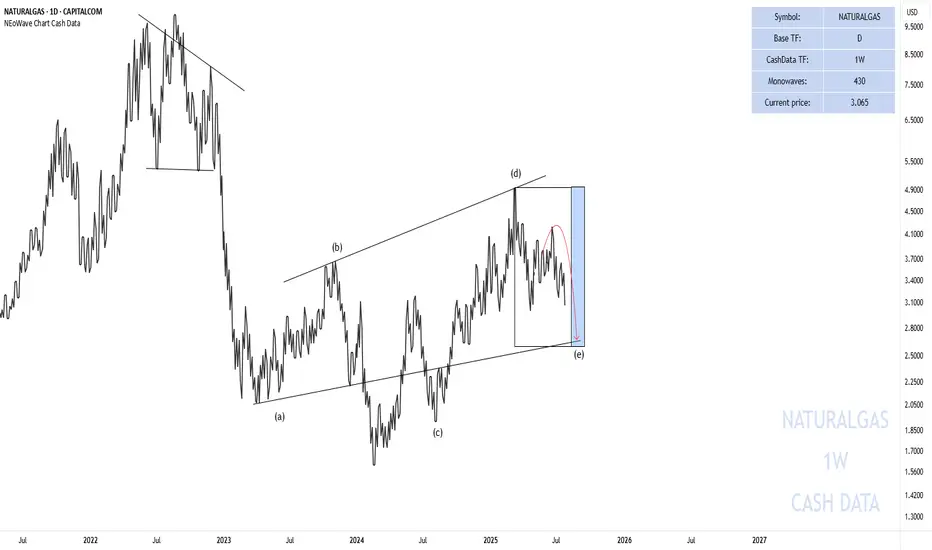
End of the Wave-(e) Natural Gas
In the previous analysis I said that:
Currently, wave-(e) is forming and I do not expect a strong upward movement until August 12-September 12 and this wave can take time until the time range I specified for it.
In the picture you can see that the price has started to decline again exactly from w
See all ideas
Displays a symbol's price movements over previous years to identify recurring trends.