NATGAS Short1)Trend defined. 4h downtrend.
2)Contradictory entry. Just after a double top.
3)Default loss. A bit above the double top.
4)Default target level. 2.95.
5)Risk <= 3%.
6)Singular trade.
7)Trades placed today <= 5.
NGSUSD trade ideas

NATGAS SHORT SETUP Currently NATGAS is facing the Resistance at the 24EMA on the 4H after breaking the Intermediate Trend line that was the previous up trend.
The market on the Long term remains bullish but currently facing Rejection. We will take a short at this level but be cautious as this market can move up any time.

NATGAS Short1)Trend defined. 4h downtrend.
2)Contradictory entry. Just after a double top.
3)Default loss. A bit above the second high of the double top.
4)Default target level. 5.47.
5)Risk <= 3%.
6)Singular trade.
7)Trades placed today <= 5.

NATGAS LONGNATGAS remains positive after breaking the 20SMA on the 4H.
With CMO and CMF turning upside we can see money is flowing into the NATGAS markets. With RSI Above 50 and daily and weekly Ichimoku showing us Bullish Bias we will consider taking a Long.
Stay tuned for the correct entry price, and drop a follow if you like the ideas!!

Natural Gas will see half cent the priceIn my analysis, gas price is traveling along the wave E, and now is finishing wave b of a zigzag. And i will soon head down to complete a 5-wave race.
At its peak, Russia enjoyed gas export to Europe, thus leaving The USA a big loser.
She then pushed to retaliate for the lost market and caused the Ukraine war and sold arms equivalent to the amount of the gas deal.
Thus getting back all the money Russia gained out of the gas deal.
Iran-Turkey gas transfer deal is nearing its term soon.
So iran will not make a cheap deal.
If prices drop according to my analysis, Iran wil reduce its gas transport by more than half. And will provide steel, petrochemical industry and cement factories with abundant supply of gas and we will see the economy grow faster.
By then, oil prices will reach to more than 160 dollars a barrel.
I hope the best for Iran.

4-hr NGAS: A $0.64 Drop on the Radar
Natural Gas has surged over 110% since August, reaching a peak of $4.18. While it remains a highly volatile commodity with frequent price swings, a clear support zone has formed between $3.00 and $3.20. However, since last week, NGAS has corrected by more than 20%, dropping below the crucial 38.2% Fibonacci retracement level. The RSI has moved into neutral territory, but the decrease in trading volumes indicates that further downside is possible.
As the stock market rises and investors focus on equities, this could trigger a short-term sell-off in Natural Gas. This theory is reinforced by the fact that commercial traders have already built up their reserves ahead of the winter season, which drove buying activity in August, September, and November.
Given these factors, we anticipate that NGAS may continue its downward correction, potentially revisiting the $3.00 zone. This level not only acted as resistance in the past but also aligns with the critical 61.8% Fibonacci retracement. If this support holds, it could provide a base for a potential rebound later on.

NATGAS // Can you imagine $1?This weekly candle looks bearish. It's even more bearish if we take into account that it was printed on the monthly impulse base.
It means that the monthly trend is still short, and if the weekly gets aligned, the price may target the last clean weekly breakout (red), where the countertrend line also breaks, and where the $1 for natural becomes a nice target.
Do you see it coming?
———
Orange lines represent impulse bases on major timeframes, signaling the direction and validity of the prevailing trend by acting as key levels where significant momentum originated.
Level colors:
Daily - blue
Weekly - purple
Monthly - magenta
H4 - aqua
Long trigger - green
Short trigger - red
———
Stay grounded, stay present. 🏄🏼♂️
<<please boost 🚀 if you enjoy💚

Natural Gas...Ready to Go Up Again...If Opens at Positive Note As we are seeing very sharp fall in NG from last 3 days...Weekly candle is most bearish candle with decent volume as well but as we come to daily time frame fall in volumes can be seen which denotes less interest on selling side and as trendline and EMA also showing support at 3.15-3.17 level , hope this level will not break on Monday. And if took a good support from this level ,get ready for new high above 4 dollers within next 2 weeks .

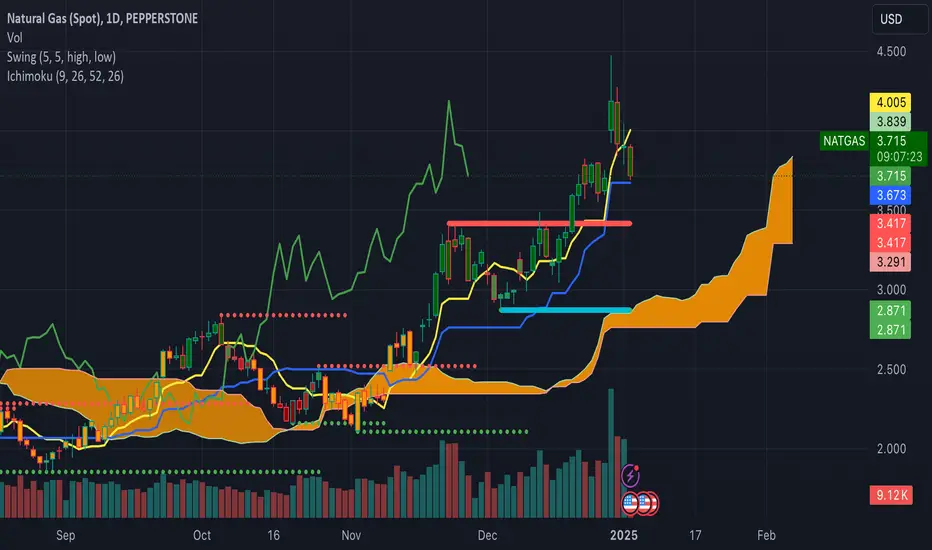
NATGAS Setup Comprehensive Trading Plan for Natural Gas (NATGAS)
Market Bias:
Bullish with a retracement phase:
• Weekly timeframe: Strong uptrend with overbought signals but well above the Ichimoku cloud and SMAs, showing long-term bullish momentum.
• Daily timeframe: Bullish, but in a healthy pullback phase with support around the 0.382 and 0.5 Fibonacci levels.
• 4H timeframe: Price is testing support levels but remains above the Ichimoku cloud and key SMAs (100 and 200), signaling potential for a bullish reversal from oversold conditions.
Key Levels to Watch:
Support Levels (Potential Entry Zones):
1. Primary support: 3.67 - 3.71 (confluence of 100 SMA (4H), Ichimoku cloud, and Fib 0.5-0.618 retracement).
2. Secondary support: 3.54 - 3.59 (Fib 0.786 retracement and approaching 200 SMA on 4H).
3. Deep support: 3.29 - 3.35 (Daily Ichimoku base line and Bollinger Band lower range).
Resistance Levels (Take-Profit Areas):
1. 4.00 - 4.05: Daily Ichimoku base line and Bollinger Band upper resistance.
2. 4.14 - 4.20: Swing high and key Fib extension (1.618).
3. 4.31: Fibonacci extension (potential breakout target).
Actionable Setup:
Entry Plan (Bullish Reversal Strategy):
1. Primary Entry (Shallow Pullback): 3.67 - 3.71:
• Enter long if:
• 4H RSI crosses above 50.
• VW MACD turns green with positive momentum.
• Chaikin Oscillator turns positive, indicating buying inflow.
• Suggested leverage: x10 - x15.
2. Secondary Entry (Deeper Pullback): 3.54 - 3.59:
• Enter long if:
• Price finds support at the 200 SMA (4H).
• OBV forms a higher low and moves upward.
• CMF turns from negative to neutral/positive.
• Suggested leverage: x15.
Stop-Loss (SL):
• Conservative SL: 3.50 (below the Fib 0.786 level).
• Aggressive SL: 3.29 (below Daily Ichimoku base line and 200 SMA).
Take-Profit (TP):
1. TP1: 4.00 - 4.05 (+8.0%) – Ichimoku resistance and round number.
2. TP2: 4.14 - 4.20 (+12%) – Recent swing high and Fib extension.
3. TP3: 4.31 (+16.5%) – Potential breakout target from Fib 1.618 extension.
Trade Conditions for Confirmation:
• Daily RSI: Must remain above 50 to confirm that bullish momentum is intact.
• 2H and 4H MACD: Must show a green shift (waning bearishness and increasing bullish pressure).
• Chaikin Oscillator: Must approach zero or turn positive, confirming capital inflows.
• CMF: Should shift closer to or above zero to validate buying interest.
Position Management:
• Scaling in: Add to the position if price holds above the 100 SMA (4H) after initial entry and indicators remain bullish.
• Move SL: Once price reaches TP1, move stop-loss to breakeven (initial entry).
• Partial take-profit: Secure partial profits at TP1 and TP2 to lock in gains while letting the remaining position run toward TP3.
Example Position Plan:
• Entry: 3.67 - 3.71
• SL: 3.50 (conservative)
• TP1: 4.00 (+8%)
• TP2: 4.14 - 4.20 (+12%)
• TP3: 4.31 (+16.5%)
Additional Notes:
• Risk-to-Reward Ratios (R:R):
• R:R for TP1: ~2:1
• R:R for TP3: ~3.5:1
• Avoid Premature Entries:
• If the price continues below 3.54 without bullish confirmation, wait for a potential re-entry at 3.29 or reassess the structure for further downside.
Summary:
• The overall bias is bullish, but the pullback phase suggests waiting for confirmation signals before entering. Key zones around 3.67 - 3.71 and 3.54 - 3.59 are potential support levels for re-entry, while resistance levels 4.00, 4.14, and 4.31 serve as profit targets. Monitor volume-based indicators (OBV, Chaikin) and trend indicators (MACD, RSI) for validation before entering a long position.
NATGAS BUYNATGAS will move to 4 and above, Daily structure is bullish and we have pulled back to a Good level on the 4 hour, we wait now for Bullish momentum to return into the market and we buy.

Natgas to take the top again.Natgas has filled FVG. let it consolidate for 8-10 hours. Look for buys to take the top once more.
4.5 is the next target

Cold Weather Sparks Natural Gas Rally – $5+ in Sight!🔥 Natural Gas Breaks Out – Bulls Charge as Cold Weather Fuels Demand! 🔥
Natural Gas Futures are soaring, backed by January’s colder-than-expected weather forecasts driving heating demand. The breakout above the critical $3.614 level signals powerful bullish momentum, with prices now trading around $3.8610 .
🚀 Why This Rally is Just Getting Started:
$3.614: A Key Level Overcome
Previously a strong resistance, this level had historically acted as support. Its decisive break confirms a shift in market dynamics and solidifies the bullish trend.
Gap to Be Filled at $4.1681
A price gap at $4.1681 suggests a strong upward magnet, as markets often seek to close such gaps. This aligns perfectly with the next major resistance target.
🌟 Trade :
Current Price: $3.8610
Take Profit 1: $4.1681 – The gap-fill level and next major resistance zone.
Take Profit 2: $5.3064 – A long-term target if cold weather continues to drive demand.
Stop Loss: $3.4300 – Protect your capital below this level, as it marks the lower boundary of this bullish momentum.
Natural gas is heating up, and the market is poised for an extended rally. The breakout above a historically significant level, combined with the gap at $4.1681, underscores strong bullish potential. With January’s cold weather expected to persist, this rally could have plenty of room to run.
The bulls are in control – ride the wave to new highs! 🐂🔥

We would buy quite a lot of NATGAS when $2 levels are reachedWe hope the price will go down so we can buy cheaper


Gas looking ask zone After overcoming the highs for this year, the trend suggests recovering the demand zones with force… be happy

Natural gas idea for 17th July 2024, bullish.📈🚀 Bullish on NATGAS! 🌟
Hey everyone! 🙌 I’m analysing about natural gas right now! Here’s why I’m bullish:
Strong Support Zone: Found a solid support zone on the daily timeframe from around $1.5 to $1.9. This is where buyers have been stepping in recently, which is a great place for purchases! 🛡️💪
First Target (TP1): My first resistance zone (where I’ll take some profit) is between $3.4 and $3.7. This is where we might see some selling pressure, but if we break through, it’s gonna be a breakthrough! OBVIOUS?10000%!! 📈💰
Second Target (TP2): The next resistance zone is from $4.9 to $5.3. If NATGAS hits this, we’re in for a big win! 🚀💵
What happens next? Only God knows!
🔍 Okey, short story about what is backing up my theory:
Increasing Demand: With hotter weather and rising electricity use, natural gas demand is up! More AC means more gas! 🌞🔌 And don't forget about the upcoming winter ❄️🔥; heating needs will push demand even higher!
Supply Concerns: Global tensions with Russia, the Middle East, and Trump assassination affect supply chains. Issues are keeping supplies tight, which is driving prices higher. 🌍📉
Green Energy Shift: Even as we move to greener energy, natural gas remains a key player as a cleaner alternative to coal and oil. Your friend’s Tesla won't work without coal, oil, or gas! 🌱⚡
Overall, NATGAS looks super promising right now. Let’s keep an eye on it and ride the wave! 🌊
#Trading #NatGas #Bullish #Stocks #Investing #SupportAndResistance
Feel free to share your thoughts or ask questions! Let’s make some gains! 🤑🚀

NATGAS momentum lossI can see natural gas loosing momentum and volume divergence. No more interested in buys. Look for sells only. I need the price to fill the Fair Value gap around 2.6. Trade with care risk only 1%.

"NATURAL GAS" Commodities Market Bullish Heist PlanHello!! My Dear Robbers / Money Makers & Losers, 🤑 💰
This is our master plan to Heist "NATURAL GAS" Commodities Market based on Thief Trading style Technical Analysis.. kindly please follow the plan I have mentioned in the chart focus on Long entry. Our target is Red Zone that is High risk Dangerous level, market is overbought / Consolidation / Trend Reversal / Trap at the level Bearish Robbers / Traders gain the strength. Be safe and be careful and Be rich.
Entry 📈 : Can be taken Anywhere, What I suggest you to Place Buy Limit Orders in 15mins Timeframe Recent / Nearest Low Point take entry should be in pullback.
Stop Loss 🛑 : Recent Swing Low using 2H timeframe
Target 🎯 : 3500.0
Attention for Scalpers : Focus to scalp only on Long side, If you've got a lot of money you can get out right away otherwise you can join with a swing trade robbers and continue the heist plan, Use Trailing SL to protect our money 💰.
Warning : Fundamental Analysis news 📰 🗞️ comes against our robbery plan. our plan will be ruined smash the Stop Loss 🚫🚏. Don't Enter the market at the news update.
Loot and escape on the target 🎯 Swing Traders Plz Book the partial sum of money and wait for next breakout of dynamic level / Order block, Once it is cleared we can continue our heist plan to next new target.
💖Support, Like and follow our Robbery plan we can easily make money & take money 💰💵 Follow, Like & Share with your friends and Lovers. Make our Robbery Team Very Strong Join Ur hands with US. Loot Everything in this market everyday make money easily with Thief Trading Style.
Stay tuned with me and see you again with another Heist Plan..... 🫂

Natural Gas Bullish Chart Breakout RetestNatural gas has given breakout last week good volume and retraced back on friday on previous resistance zone.
As per Global Weather data Heating demand has continuously rising in this Winter due to cooling air flow.
next week mostly big gap up with fast move can be seen.

Break out or Turning Point?We're at a historically important point that spans all the way back to 2016.
From here, we'll either break down until next demand season, or break-out to $3.5-$4.
Stay nimble, don't get tied down by your hopes or potential profit.

Natural Gas | Chart & Forecast SummaryKey Indicators On Trade Set Up In General
1. Push Set Up
2. Range Set up
3. Break & Retest Set Up
Notes On Session
# Natural Gas
- Double Formation
* 012345 | Wave 1&2 | Subdivision 1
* 2.0500 USD | Support Area
- Triple Formation
* Retracement 50% | Uptrend Bias | Subdivision 2
* 3.2000 USD | Resistance Area
* Top Bottom Structure | Gaining HH At 3.6700 USD | Subdivision 3
Active Sessions On Relevant Range & Elemented Probabilities;
London(Upwards) - NYC(Downwards)
Conclusion | Trade Plan Execution & Risk Management On Demand;
Overall Consensus | Buy

"NATURAL GAS" Commodities Market Bullish Heist PlanHola! Ola! My Dear Robbers / Money Makers & Losers, 🤑 💰
This is our master plan to Heist "NATURAL GAS" Commodities Market based on Thief Trading style Technical Analysis.. kindly please follow the plan I have mentioned in the chart focus on Long entry. Our target is Red Zone that is High risk Dangerous level, market is overbought / Consolidation / Trend Reversal / Trap at the level Bearish Robbers / Traders gain the strength. Be safe and be careful and Be rich.
Entry 📈 : Can be taken Anywhere, What I suggest you to Place Buy Limit Orders in 15mins Timeframe Recent / Nearest Low Point take entry should be in pullback.
Stop Loss 🛑 : Recent Swing Low using 2H timeframe
Target 🎯 : 3.500
Attention for Scalpers : Focus to scalp only on Long side, If you've got a lot of money you can get out right away otherwise you can join with a swing trade robbers and continue the heist plan, Use Trailing SL to protect our money 💰.
Warning : Fundamental Analysis news 📰 🗞️ comes against our robbery plan. our plan will be ruined smash the Stop Loss 🚫🚏. Don't Enter the market at the news update.
Loot and escape on the target 🎯 Swing Traders Plz Book the partial sum of money and wait for next breakout of dynamic level / Order block, Once it is cleared we can continue our heist plan to next new target.
💖Support our Robbery plan we can easily make money & take money 💰💵 Follow, Like & Share with your friends and Lovers. Make our Robbery Team Very Strong Join Ur hands with US. Loot Everything in this market everyday make money easily with Thief Trading Style.
Stay tuned with me and see you again with another Heist Plan..... 🫂

Natural Gas 240 mins timeframe Price trading in a narrow range and ready for a trending move either side. keeep an eye on both trendline resisitance and support.
