NATGAS LONG TERM TRADE analysiAug 27
Hello Traders
In This Chart NATGAS HOURLY Forex Forecast By FOREX PLANET
today NATGAS analysis 👆
🟢This Chart includes_ (NATGAS market update)
🟢What is The Next Opportunity on NATGAS Market
🟢how to Enter to the Valid Entry With Assurance Profit
This CHART is For Trader's that Want to Improve Their Technical Analysis Skills and Their Trading By Understanding How To Analyze The Market Using Multiple Timeframes and Understanding The Bigger Picture on the Charts
NGSUSD trade ideas
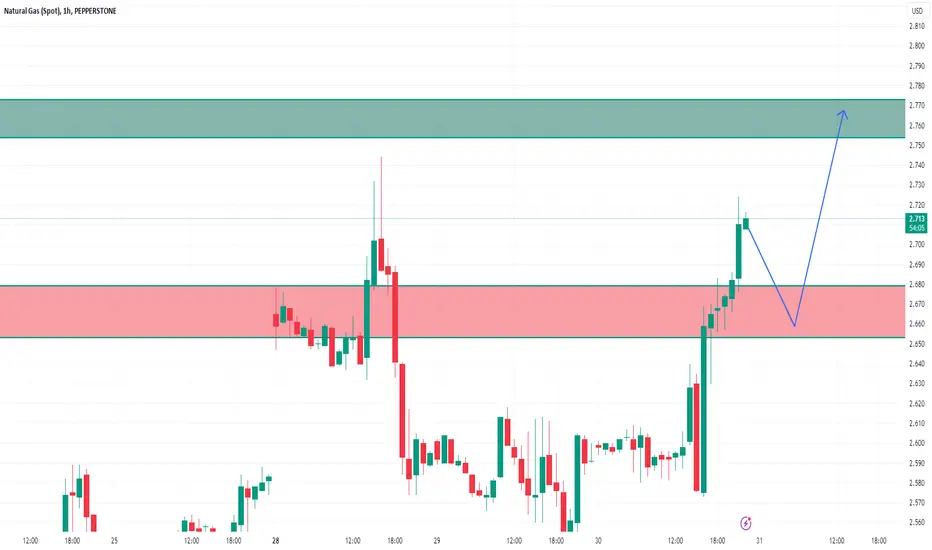
NATGAS, to target 2.76 on 30-min chartNATGAS
On the 30-min chart, there is 2.70 then 2.76
More targets after crossing 2.76 up to 3.2 , 3.5 in a few weeks
Technical indicators RSI and MACD are positive for the up trend.

xngusd.....DTechnical analysis of gas against the US dollar on the daily time frame.
= The analysis is based on trend analysis and Wyckoff's Laws
= If the price exceeds the downtrend and also exceeds the level of 2.882, then it becomes eligible to rise to the level of 3.693
= If the price exceeded the level of 3.693, it qualifies it to rise to the level of 4.812

NATGAS LONG TERM TRADE analysisHello Traders
In This Chart NATGAS HOURLY Forex Forecast By FOREX PLANET
today NATGAS analysis 👆
🟢This Chart includes_ (NATGAS market update)
🟢What is The Next Opportunity on NATGAS Market
🟢how to Enter to the Valid Entry With Assurance Profit
This CHART is For Trader's that Want to Improve Their Technical Analysis Skills and Their Trading By Understanding How To Analyze The Market Using Multiple Timeframes and Understanding The Bigger Picture on the Charts

NATURALGAS ANALYSISHello traders,
Here is some patterns which I see with natural gas. We will assess break of trendlines to enter our longs as confirmation.
Goodluck!

Natural gasI think the divergence observed in D1 and W1 RSI can make the price to rally to 3.6 usd and may even get to 4.9 usd in the coming weeks.

Is the Price of Natural Gas Forming a New Trend?The US Energy Information Administration said on Thursday that natural gas inventories in US storage rose by 18 billion cubic feet in the week ended Aug. 18. That was below the 29 billion cubic feet increase forecast by analysts polled by S&P Global Commodity Insights.
It is possible that market participants thought that insufficient filling of storage facilities will lead to a rise in gas prices in the coming winter. According to the forecast of the International Energy Agency (IEA), the price of gas will peak at USD 3.44/MMBtu in December 2023 (approximately +36% from current levels).
The natural gas price chart shows that:
→ in July-August, a series of rising supports was formed;
→ the peak of August is higher than the peak of June, which in turn is higher than the peak of May.
A sequence of higher extremes could indicate that the market is in an uptrend that could bring the price closer to the IEA's price targets. The nearest resistance on this way is the level of 2.78, which in July-August repeatedly influenced the price dynamics.
This article represents the opinion of the Companies operating under the FXOpen brand only. It is not to be construed as an offer, solicitation, or recommendation with respect to products and services provided by the Companies operating under the FXOpen brand, nor is it to be considered financial advice.

Bullish ON GasBULLISH DAILY RSI ONE 1 DAY SUPPORT! after summer,we waiting for GAS price to be expensive!

Natural Gas May Move Down FurtherNatural Gas May Move Down Further
This is an old analysis that I am sharing from the top when the price was at $3.00
As you can see the price is already at 2.6 and the chances are that the bearish moment
has not over yet.
So far the price is developing another bearish pattern and the chances are growing again for more downside.
if the price will break through the bearish flag pattern it could move down
up to 2.5 and 2.4
Thank you and Good Luck!

Natural Gas 🥱It's becoming tiresome as this is is bouncing around more than me in my younger days, but it's my only trade ATM. Happy to chart other things on request!
I am still long, and still waiting in anticipation of a big green god candle. My reasoning behind the bullish stance on Gas is still Energy, more poingnantly access to energy.
Fingers crossed in the future we won't need fossil fuels, but the last I checked we still do and it's being used prolifically.

Nat gas long term My prediction of nat gas long term. Creating a double bottom and the target would be 4 which would also come close to the gap down.

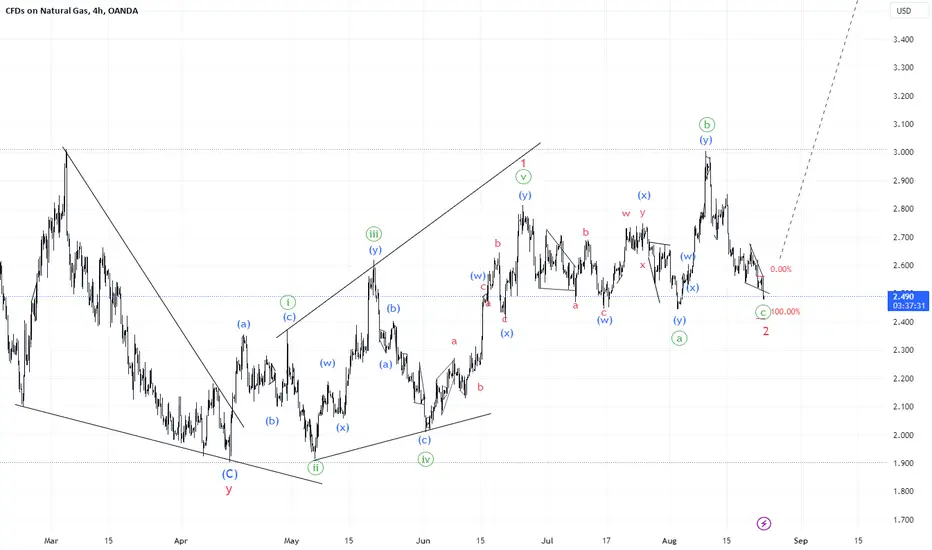
NatGas UpdateAlthough the price largerly followed previously posted scenario the retracement is too deep to ignore. I am inlclined to think that we might be through waves (1) and (2) at this point and is about to start an abrupt ascend in wave (3)
NATGAS LONG TERM TRADE analysisHello Traders
In This Chart NATGAS HOURLY Forex Forecast By FOREX PLANET
today NATGAS analysis 👆
🟢This Chart includes_ (NATGAS market update)
🟢What is The Next Opportunity on NATGAS Market
🟢how to Enter to the Valid Entry With Assurance Profit
This CHART is For Trader's that Want to Improve Their Technical Analysis Skills and Their Trading By Understanding How To Analyze The Market Using Multiple Timeframes and Understanding The Bigger Picture on the Charts

NATGAS_1DHello
Buy
Gas analysis based on Elliott waves in daily and long-term time frames
Gas is in an important support range and two situations can be considered
First, in the same range, 2,500 markets enter a fluctuating range, which can be time-consuming
The second case, which has a stronger possibility, due to the breaking of the upward trend line and maintaining the number and area of 2.500, can enter an upward correction to the target of 3.900, 5.000 and even 6.000, which is the first The target is important

#NatGas UpdateUpon closer examination of the near-term wave subdivisions, I call back the statement that initial wave (a) of the remaining 2023 uptrend might be complete and replace it with a diagonal.
Again, I have to cautiously mention that such projections are very speculative at this stage. I shall be ready to alter my view at any point if I receive new information.

NATGAS LONG TERM TRADE analysisHello Traders
In This Chart GOLD HOURLY Forex Forecast By FOREX PLANET
today Gold analysis 👆
🟢This Chart includes_ (GOLD market update)
🟢What is The Next Opportunity on GOLD Market
🟢how to Enter to the Valid Entry With Assurance Profit
This CHART is For Trader's that Want to Improve Their Technical Analysis Skills and Their Trading By Understanding How To Analyze The Market Using Multiple Timeframes and Understanding The Bigger Picture on the Charts

NATGAS long viewNATGAS could trigger a bullish scenario if we move above the $2.60 level. After that, potential targets are above the $2.70 to $2.80 level.

A Naked Chart. I don't think Natural Gas is range bound, my interpretation is thus: The Daily Chart, as well as the Weekly shows that it is in a clear uptrend, being traded well, I believe it is in the midst of a clean, albeit slow reversal from an overshot, oversold position.
Caution is advised trading this commodity, but I think the idea of shorting at this stage, in my humble opinion, is madness.
I've been wrong plenty of times before and yes, I play around trying to call exact turns on the hour with mixed results, but this is my conviction.
Gas is about to start an overall Macro wave 3 that could take the price back and even above previous ATHs of $16.

NATURAL GAS
Do you think he will ever recover? This is something that the world simply needs and I think that the best opportunities are being created now.
But as in investing, so in trading, we always have to look at some levels for the future

Natural Gas, Trading range first.NATGAS / 1D
Hello trdaers, welcome back to another market breakdown.
NATGAS has been trading in a down trend, the price has rejected the preious resistance level.
For a higher probability setup, the one should wait for a trend line break.
Checkout the chart for my trigger plan.
Trade safely,
Trader Leo

Natural Gas: The Bears Have The Price Control-Textbook ExampleNatural Gas: The Bears Have The Price Control
Since the previous analysis of the price, we saw that the price faced a very strong resistance near $3.05 and it moved down very quickly this time.
On a daily time frame, NG looks like it has room to move down even more.
On a lower time frame, the price created a 5-wave movement and 3-wave correction.
it looks like we are in a textbook example and the chances are that NG may move down for the A wave or 3rd Elliot wave.
The maximum I am watching this time is 2.2
You may find more details in the video!
Thank you and Good Luck!

EUR/JPY Long, NZD/USD Short and NATGAS/USD ShortEUR/JPY Long
• If price pushes down to and ideally just below our area of value and it doesn't do so impulsively, then I'll be looking to get long with a risk entry either after a phase line break on either the one hour or the fifteen minute chart, or after a one hour rejection from it.
• If my entry requirements are not met then I will simply wait until another setup which meets my plan materialises.
• If there's any ambiguity then I will not place a trade on this pair.
NZD/USD Short
• If price pushes up to and ideally just above our preferred area of value, then regardless of how it does so I'll be waiting for a convincing impulse back down followed by a tight flag and then I'll be looking to get short with either a reduced risk entry on the break of the flag or a risk entry within it.
• If my entry requirements are not met then I will simply wait until another setup which meets my plan materialises.
• If there's any ambiguity then I will not place a trade on this pair.
NATGAS/USD Short
• If price corrects and a larger three touch one hour flag forms, then I'll be looking to get long with a risk entry within it.
• If my entry requirements are not met then I will simply wait until another setup which meets my plan materialises.
• If there's any ambiguity then I will not place a trade on this pair.

Sell on Rise Market in Natural GASSell the Natural GAS on Rise for the Target of 2.550
STOP Loss 2.900
