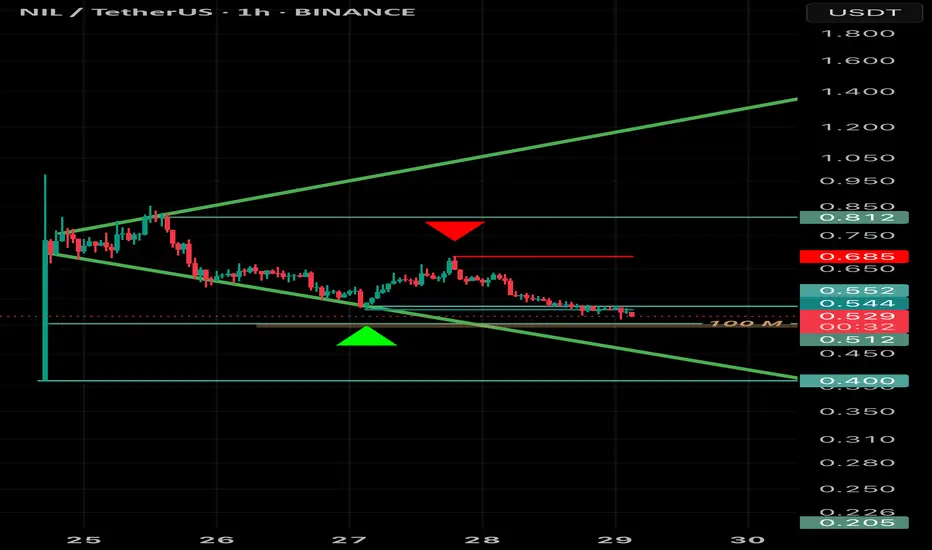
NIL ANALYSIS (4H)The NIL correction started from the point we marked as Start on the chart.
This correction appears to be a Diametric, and it seems we are currently in wave E of this pattern. The price is expected to follow the path indicated by the arrow.
A daily candle close above the invalidation level will invalidate this analysis.
invalidation level: 0.521$
For risk management, please don't forget stop loss and capital management
When we reach the first target, save some profit and then change the stop to entry
Comment if you have any questions
Thank You
NILUSDT.P trade ideas

NILUSDT Forecast: Anticipated Bearish Move AheadBased on the EASY Trading AI strategy analysis, NILUSDT currently demonstrates bearish sentiment. Our entry point is marked at 0.502 with projected targets indicating downward movement toward a Take Profit at 0.47033333. Protective Stop Loss is clearly defined at 0.54033333 to mitigate potential risk.The trading model identified this sell signal due to weakening bullish momentum, price-volume divergence, and emerging resistance around the 0.502 region. These combined factors point towards a short-term bearish phase.Traders, remain disciplined and adhere strictly to provided entry, take-profit, and stop-loss parameters to optimize risk management and trade efficiency.

$NilIs nil going to nil?
Probably last chance to bounce somewhere around here. Bullish if reclaim 0.55$
NILUSDT Hourly Technical AnalysisNILUSDT Hourly Technical Analysis
Nillion Coin is experiencing selling pressure below the 21-day moving average in the 1-hour technical analysis. Currently, it is trying to recover after forming support at 0.5441. The decline in Bitcoin has also affected Nillion Coin. Indicators are partially positive and moving in a neutral position. For NILUSDT to recover, it needs to break above the 21-day moving average and surpass resistance levels.
NOT INVESTMENT ADVICE.
The information, comments, and recommendations provided here do not constitute investment advice. Investment advisory services are offered within the framework of an investment advisory agreement signed between investors and brokerage firms, portfolio management companies, or non-deposit banks. The opinions expressed on this page are solely personal views. These views may not be suitable for your financial situation, risk tolerance, or return preferences. Therefore, no investment decisions should be made based on the information and statements provided on this page.
To stay updated on our analyses, whether positive or risky based on technical indicators, we would appreciate it if you follow and like us.

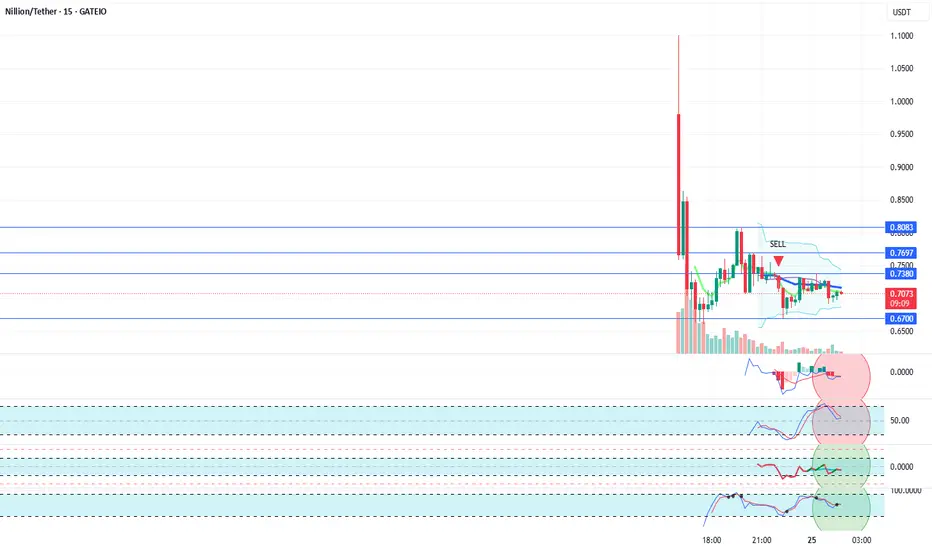
NILUSDT 15 Minute Technical AnalysisNILUSDT 15 Minute Technical Analysis
Nillion Coin's 15 minute chart on Binance is currently showing a sideways movement. It is above the 0.67 support level and moving at the same level as the 21-day moving average line. We believe Nillion Coin has the potential to rise to higher price levels. There is a possibility of retesting the 0.8083 resistance level. Since hourly and daily technical data are not available at the moment, we are sharing the analysis based on 15 minute data.
NOT INVESTMENT ADVICE.
The information, comments, and recommendations provided here do not constitute investment advice. Investment advisory services are offered within the framework of an investment advisory agreement signed between investors and brokerage firms, portfolio management companies, or non-deposit banks. The opinions expressed on this page are solely personal views. These views may not be suitable for your financial situation, risk tolerance, or return preferences. Therefore, no investment decisions should be made based on the information and statements provided on this page.
To stay updated on our analyses, whether positive or risky based on technical indicators, we would appreciate it if you follow and like us.