NKNUSDT broke out descending resistance#NKNUSDT
$NKN broke out descending resistance. still maybe price come down for another confirmation of resistance as support
it seems it can reach $0.29 and maybe $0.33 in coming days or weeks
NKNUSDT trade ideas

How NKN is looking???Hello everyone ! After its ATH 100 days past aproximately, and it is down %85 nearly percent. The chart is clear and self explanatory.
Have a nice day !

NKN/USDT Is About To Get Smashed by Bears 🐻 🐻 🐻 📉 NKN/USDT | Potential Downward Movement
💡 Sell Limit Order @ 0.21767
🎯 Target Profit 0.20613
🛑 Stop Loss 0.22348
❌ Do not risk more than 1% of your account on each trade
Description:
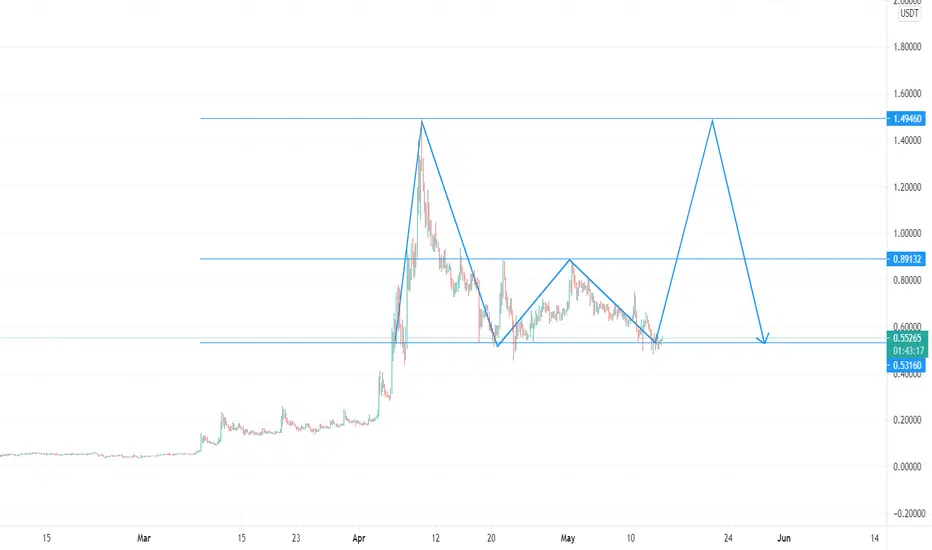
The coin succeeded to break the triangle to the downside by posting a double top near the strong resistance. A higher correction is expected to the neckline and then a sell off all the way down to the target profit.
-------------------------------------------------------------------------------------
Please press “Like” if you appreciate the trading idea 👍
“Follow” for more trading ideas in the future 👀
“Comment” below to share your thoughts with us and other traders 👥
-------------------------------------------------------------------------------------
Risk Disclaimer: All trading ideas published by “collegeofpips” are for educational purposes only. These posts can help you to enhance your trading skills, but please do your own research before opening any trading position. ⚠️ -------------------------------------------------------------------------------------
🙂 Good Luck!

NKN june 21st, 2021Chart says it all. still in a triangle pattern, needing to break disjoint channel. BTC needs to hold its current support for this to stay valid though.


NKN BreakoutNKN has great potential for a nice 100-200% gain. Use a tight stop loss :) --- Safe trading

NKN Lagging Behind MTL & About To PumpBINANCE:NKNUSDT
BINANCE:MTLUSDT
NKN is following a fairly similar fractal to MTL's retracement that finished & is now moving up, however, NKN is lagging behind MTL by an estimated 3-days. This chart estimates that NKN should begin its next upswing within the next 6 days.
Chart is pretty much explained via text in-chart, comment below if you have any questions.
Anyone holding MTL could possibly ride MTL's wave to the top & sell into NKN to multiply profits?
*NFA*


nkn may 31moving sideways to finish wedge pattern, MACD shows bullish crossover. short term prediction on fib levels

NKNUSDT Inverse head and shouldersAsyou can see in this chart, NKN has formed an inverse head and shoulders.
For a good entry, you could wait for a little pullback below the nechline and for a safer entry, then buy the breakout of the yellow line.

flash pattern reversal nkn may 24th1. reversal pattern flashed at peak.
2. followed by 50% drop.
3. retrace back to 80% from peak.
4. followed by another to 30% from peak.
5. eventually bottomed at 15% from peak.
currently should follow step 3 now
ps: btc is following this same pattern from 13-17 bull/bear run
steps seem to follow btc minus the continuous head and shoulder patterens


NKN heading to retest all time highAscending triangle breakout, price hammered into support zone and bounced.
All the markings of a bull setup. I just market bought in here.
Check out that scam wick to run stops into support zone.


nkn may17th RSI shows we are at a bottom. so with that said we made a higher low and now setting up for a higher high. Gan pitch should give a rough estimate of the movement for the coming days. this only stays valid if we continue to close above are previous low. otherwise wed have a double bottom, which could mean a set up to drop.

New Kind of Price for a New Kind of NetworkHello all.
If you're interested in investing in NKN please pick some up at .18 in the next few days.
Thank you.


NKN can go upto $1.50 With High volume and 5-26 getting closer, NKN looks good.
T1- 0.75
T2- 0.81
T3- 0.89
T4- 1.06
T5- 1.24
T6- 1.41


nkn may15th-lot of mixed signals from indicators but a few that are promising
.5 fib matches are avg. .5 fib was traced from our ATH and the most recent wave of MAY

Nkn analysisPrice is on a range right now and it's strong so am waiting for a break from the bulls to continue the trend,that is for now we are still expecting a pump to breakout
The zone at the bottom is the last pullback before the pump eventually if price breaks below that will result to a structure break/trend break 🗣️🗣️ BULLISH
Like share follow
Thanks for reading

nkn may 12thGanFan and fib tracements from several different lows and highs those are the ones that lined up.
