NKNUSDT trade ideas

NKN Longterm 400%++ GainChart by weekly, NKN in the long consolidation 150++days. After breakout from the box massive explosion can happen. Personally wait until break the box on fibo 0.382 around $0.13. Cheers!

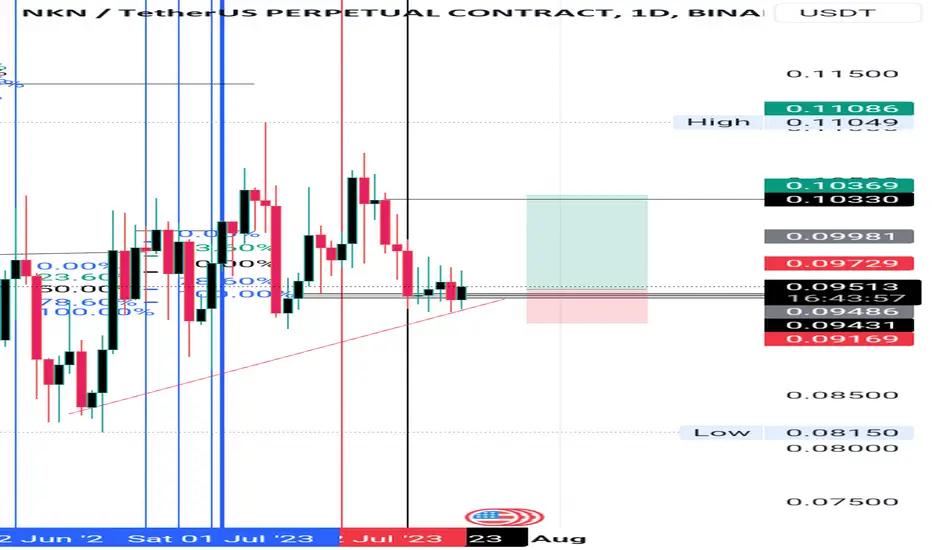
NKN/USDT Break key level area. Ready to continue upward move ??💎 NKN has undeniably attracted significant attention in the market. Currently, it has successfully broken through the key resistance level, entering a valid retesting phase at the support, which was previously a resistance zone. If there is a perfect bounce on the support area, it is probability that NKN will continue its upward movement towards our target supply area.
💎 NKN is reliant on the support area. If it returns to the retesting phase at the support area and fails to maintain or sustain above it, or worse, experiences a breakdown below the support level, it poses a danger. In such a scenario, NKN may revert to a bearish movement, potentially undergoing a downward trajectory toward the demand area or even retracing to the strong support zone.

✴️ NKN 200%+ Bullish Wave Mapped | Simplicity (Simple & Easy)Not just simple but easy... Simple and easy.
NKNUSDT moved above EMA50 back in November 2020, it struggled with the level a little bit in late 2020 until it finally managed to stay above it.
Once this level was left behind, a massive bullish wave followed. Very simple.
It has been moving, growing slowly five weeks straight and now NKNUSDT is trading again above EMA50 weekly. November 2020 vs November 2023 is exactly 3 years... That's how long it takes for a bottom to be hit, set and confirmed as a new market cycle starts.
1.5 years the bullish cycle and 1.5 years the bearish cycle.
The remaining year to complete a 4 year cycle is composed of range trading, the whales accumulation phase.
The bear market low after the 2021 bull market happened June 2022 and we have higher lows since.
The target on the chart can happen short-term... Long-term, we are likely to see many, many times more growth, maybe 10, 15 or 20X to the next All-Time High... Easy!
Namaste.

$NKN Potential Break out NKN seems to be coming out of this rounding supply line here.
In the context of an accumulation range, this would be equivalent of "jumping over the creek"
If it holds up, id look for a test of the top of the range next at the 382 / 0.16
Above that, historically its a pretty swift move up to .32 and .43
It wouldnt be alarming if we retested the bottom of the range or got a checkback on the supply line first, but a real nice start here on a reversal.

Bullish on $NKNDaily chart:
- We have a Daily OB+ created.
- We had price yesterday draw to the M.T of the Daily OB+. This was after price hit the Daily Bearish OB- open price and draw to the M.T mentioned.
H4:
- We have Price reacting off the H4 Breaker and H4 PB+. The H4PB+ and the Daily M.T + Daily OB+ are the same price level 'Coincidentally' (hehe, jk)
- We have H4 Confirming our bias with TWO OB+ and Equal highs to draw to.
NKN did not rally much after bitcoin bull run hence I presume its time.

NKN On Fire: Don't Miss Out on This Buy Trade!"**NKN** is a new kind of peer-to-peer network connectivity protocol and ecosystem that enables applications to access Web3-native networking services, such as bandwidth sharing, VPN, and load balancing, in a decentralized and secure way.
**Recent news**
* On October 25, 2023, NKN announced the launch of its mainnet 4.0, which includes a number of new features and improvements, such as support for Layer 2 scaling, enhanced security, and a more user-friendly interface.
* On October 31, 2023, NKN announced that it had partnered with Chainlink to provide decentralized oracle services to NKN-based applications. This will allow developers to build more sophisticated and reliable applications on the NKN platform.
**Fundamentals**
* NKN is built on a novel blockchain consensus mechanism called Proof-of-Relay (PoR). PoR rewards nodes for relaying traffic through the network, which helps to ensure that the network is always available and reliable.
* NKN's native token, NKN, is used to pay for network services and to participate in the governance of the network.
* NKN has a number of unique features that make it well-suited for a variety of applications, including:
* Decentralization: NKN is not controlled by any single entity, which makes it more resistant to censorship and attack.
* Security: NKN uses a number of security features to protect user data, including end-to-end encryption and distributed storage.
* Scalability: NKN is designed to be scalable to handle large volumes of traffic.
* Flexibility: NKN can be used to build a wide variety of applications, including VPNs, load balancers, and distributed storage networks.
**Disclaimer**
This is not financial advice. Please do your own research before investing in any cryptocurrency.

NKN going downThe coin has formed several cascading support levels, each of which is confirmed by a lot of touches, indicating the accumulation of unrealized liquidity behind them. There is also a decrease in the highs along the trend to the cascade, which may indicate the local priority of sellers at the moment.

NKN ScenarioPrice has successfully broken above the VMEA, confirming a bullish trend. After a summer of sideways movement, closely watching the 0.105 resistance level for a potential pullback

Down bad !
Looking for bearish setup , so I can short on this one , look at this sweet double bottom lines on comment section , the market never fails to murder eq hi & los

Nkn usdt analysis We are watching daily chart
I guess here is a good enter point
Risk to reward ratio =5.6
Stop limit is close and if we have a bad news our risk is afew

NKN LOOKS BULLISH (1D)It seems that the diametric F branch is going up. We have two TPs that I have specified
Note: This symbol has a small trading volume and is highly volatile. Be careful.

#NKN/USDT breaks the Diagonal Trendline in 4-Hour TF!#NKN/USDT breaks the Diagonal Trendline in 4-Hour TF!
Wait for successful BO of PDH or a retest to open long position.

NKN 12H ( Bullish Scenario ) #NKN 12H (Bullish Scenario)
NKN is currently experiencing a significant compression (CP) on the 12-hour timeframe, indicating a potential bullish momentum. If this compression is broken to the upside, it could lead to substantial growth for the asset.
🗣️ This scenario would become invalid if the specified support level is breached, so it's important to monitor it closely.


NKN Near to Breakout
Heavy DIPs Price is Holding Nicely
Trend Reversal is Expected Here
Pump is Coming Anytime
Buy Some & Hold

NKN : THIS MODEL SHOWS 300% INCREASENKN did shows for last month a breakdown view. According to our research, there is a high likelihood that this particular price action zone where NKN is could be a whale-smart invest zone.
Why do we consider this zone to be interesting and crucial?
We have used certain technical indicators to analyze the oversold condition of this coin and determine the expected range of market liquidity. Additionally, we have examined the growth potential of this coin based on its assets, and it appears to have a high chance of following a trend driven by structure trend in the coming time.
In the future, we will closely monitor NKN because we believe it could be very promising. Our target price is $0.20, and we anticipate that NKN could potentially increase by up to 300% in the near future.
We predict that this coin may enter a new zone characterized by a bullish trend over time.
Please note that this information is not intended as trading advice. Always conduct your own research and make trades based on your own plan and see this only as an idea.

NKN: WHALE INCREASE RETURNNKN is a cryptocurrency that has experienced a significant decline in recent months. However, our research suggests that there is a promising opportunity for a substantial increase in value, which could potentially bring the coin back to a level of $0.14 and even reach a new target of $0.20.
Based on our analysis, we anticipate a positive trend for NKN in the future. If this trend unfolds as expected, it is likely that more investors who had previously traded against the coin (shorts) could exit their positions when the trend breakout by whale increase as this chart idea shows.
Please note that this information is not intended as trading advice. It is always important to carefully manage your risk and trades. We will continue to monitor the progress of NKN in the coming period.

NKN going bullish after breaking out of it falling wedgeNKN now going bullish after its wedge hit a support

SECRET PRICE ACTION NKNUSDT 15 M CHART nknusdt on 30 m chart indication sps where's H L HH LL and rebound at PH, there's also FVG means imbalance and also there's ob so a perfect entry. Playing with spas nknusdt short call.

NKN USDT - Potential Long Setup in 1 Hr TF.BINANCE:NKNUSDT.P NKN USDT. Potential long setup in 1 hour TF. Price shows signs of gaining strength in the next fews hour based on Bullish Divergence.
The entry price and stop loss are mentioned.

NKN USDT - Long Setup After Break of L.HBINANCE:NKNUSDT NKN perfectly test it's support level. Now Try to again start bullish move toward .1400 level. After Break the L.H
