NOKEUR trade ideas


EURNOK suffers the worst sell-off in a few decadesEURNOK Forex cross pair (Euro versus Norwegian Krone) has broken all time high again after months. A previous monthly demand imbalance gained control last June 2018 and this cross pair has been rallying ever since.
Why has Norway’s Krone suffered the worst drop in half a century? Well, by doing supply and demand analysis on the monthly timeframe we can see that EURNOK forex cross pair was in a clear uptrend on. There is no reason to go short, only longs are possible by following the big picture monthly uptrend. We can see in the attachment a very strong monthly impulse around 10.35 at (1) that could eventually become an imbalance if price continues like that.
We don’t need to pay attention to Forex fundamental analysis if we are trading a supply and demand imbalances strategy and trading with the bigger picture trend. It’s taken for granted that if you trade the very small timeframes, fundamental analysis and news events will kick you out of the trade.


EURNOK March idea - revized.Area of working during the current situation, between 10.78x and 10.9x. Strong hit after the drop of oil prices but the Oil is still with a window to drop further and it would put more upward pressure on the pair, CPI of Norway came at 0.9% and Producer price index at -9%. EURNOK: No signs to drop below the current historical new ranges, so far.

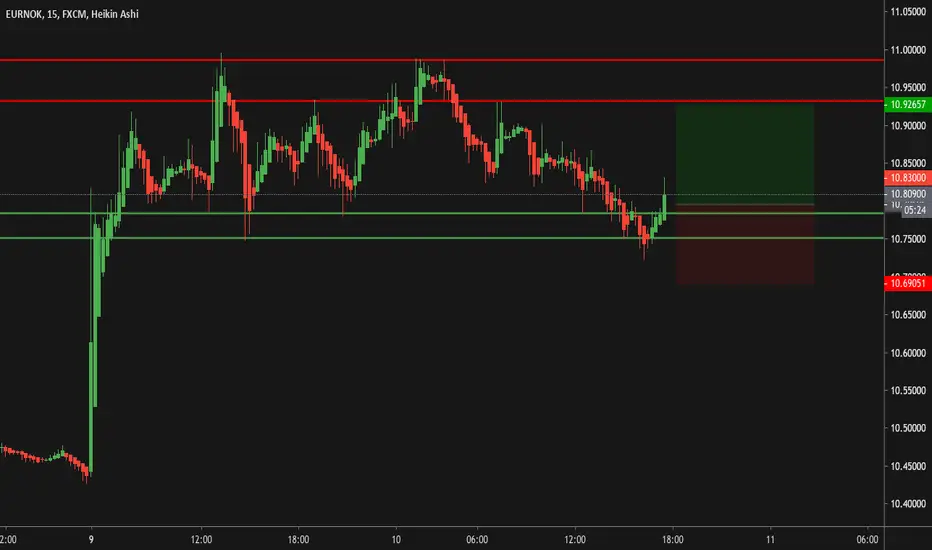
EURNOK Idea until next seasonability of structural liquidityArea of working until next seasonability of structural liquidity, between ATH of october 2019 and ATH 2014.

Long EURNOKMN uptrend
WK uptrend
1D uptrend
We have long bias, setting a long entry at 1D demand zone nested within a WK demand zone. However, if WK price broke the trendline, to remove order.


EURNOK - mean reversionNOK got undervalued due to the OIL price decline
Norges Bank interest rate: 1.5% vs ECB 0% -> carry favors NOK
Inflation is also higher in Norway
I went short on technical + fundamental factors coinciding.

EUR/NOK short/sell idea. almost 2150 pips move...in the name of ALLAH who is most merciful and the master...

EURNOK BULLISH TREND-HIGH PROBABIITY TO MAKE MONEYReversal pattern for EURNOK completed and ready to go.
EURNOK analyze built reversal pattern what is a reversal pattern, Trend reversal patterns are essential indicators of the trend end and the start of a new movement. They are formed after the price level has reached its maximum value in the current trend. The main feature of trend reversal patterns is that they provide information both on the possible change in the trend and the probable value of price movement.
What pattern do we have?
A head and shoulders pattern is a chart formation that resembles a baseline with three peaks, the outside two are close in height and the middle is highest. In technical analysis, a head and shoulders pattern describes a specific chart formation that predicts a bullish-to-bearish trend reversal.
source: Head And Shoulders Pattern Definition - Investopedia
What is the target?
The target will be probably around 10.60.
Thank you to read and good luck .

EURNOK has bearish Wolfe Wave patternIf price breakouts the wolfe wave line, short movements are possible.

EURNOKHey, here my analysis to EURNOK. XABCD Pattern? (all information in the Chart)
This is only my opinion and no financial advice!

New York Watchlist: EURNOK Sell EURNOK SELL
ENTRY 10.1580 /// MODERATE 10%
SL 10.17915 ( pips 221 )
TP 10.08605 ( pips 709 / RR 3.2 )
On 4H we have a solid contraction and we are pretty much at the top of it. RSI is at its highs too.
On 1H we have a minor contraction supportin the sell idea with a decent rejection level.
On the minute charts I see a reversal coming within this hour (in the next 50mins)


38.2% & POSSIBLE 61.8% Retracement LONG GWAVE38.2% & POSSIBLE 61.8% Retracement LONG GWAVE.
FIB Retracement Percentage is calculated in a Higher Cartesian and or Euclidean Dimension.
PLEASE ALWAYS WAIT FOR STOCHASTIC CONFIRMATION!!! THANKS.


Long EURNOKPrice is near demand zone around 10.03324-10.07569. If price shows enough bullish evidence to the upside, we go long with potential target at 10.23380. If price tests and breaks below 10.03324, we wait until price tests the 9.96883 level before going long.

