NokJpy is bearishthe pair is broken a key area downward on 4H time frame indicating bears are in control
also a price action pattern named as double top is being seen on the south suggesting target could be in the vicinity of its formation as depicted on the chart .
let'see what would happen as we suggest to enter
Related currencies

NOKJPY – Detailed Macro Analysis & Trade IdeaMacro Bias: LONG NOK / SHORT JPY
Why NOKJPY?
1. Fundamental Macro (ENDO):
Norway (NOK):
Strong inflationary pressure, positive PMI, robust M2 growth.
Massive fiscal surplus driven by energy exports – best debt/GDP ratio in the G10.
Norges Bank still maintaining relatively high interest rates.
P


NOKJPY - Buy Setup from Key SupportFOREXCOM:NOKJPY is currently at a significant demand zone that has historically attracted buyers, triggering bullish reversals. This support level has been pivotal in past price actions, forming a solid base for potential upward momentum.
The appearance of a strong bullish candle reinforces the se


NOK JPY : Huge Off Lows & Thumping LONG right now
NOK JPY bounced off its lows very recently & broke out from its oversold condition.
It then made a Fib retracement & demand just got bigger for the long trade on this.
Standby below and I will work out a Stop Loss. Longer term trade here.

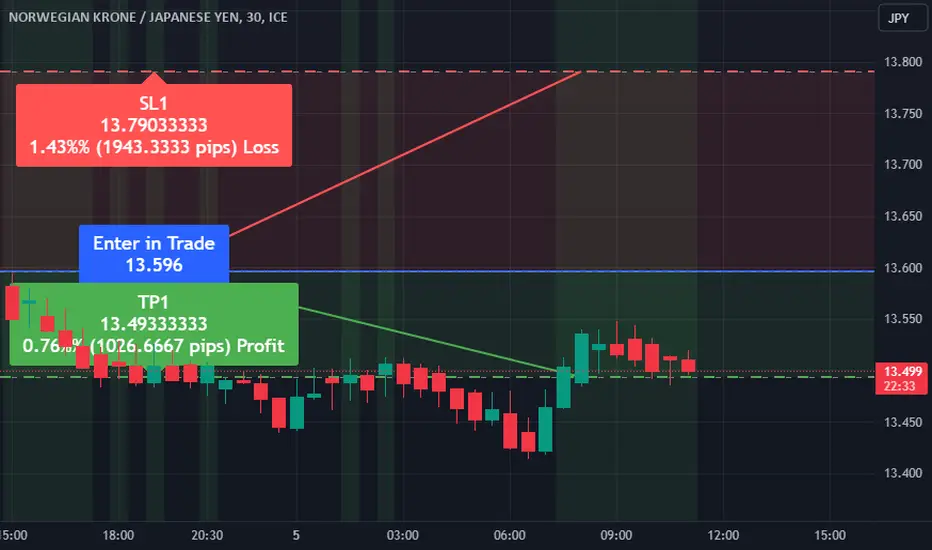
Trade Alert: NOKJPY Pair Analysis and SignalDirection: Sell
Enter Price: 13.596
Take Profit: 13.49333333
Stop Loss: 13.79033333
We are issuing a trade signal to sell the NOKJPY pair at an entry price of 13.596. The take profit level has been set at 13.49333333 and a stop loss has been placed at 13.79033333. This analysis has bee

Keep shorting Looks like we're in for swipe 2 to the downside. Keep shorting. MACD hist. is also pointing downwards, so we have a bearish convergence here.

See all ideas
Summarizing what the indicators are suggesting.
Oscillators
Neutral
SellBuy
Strong sellStrong buy
Strong sellSellNeutralBuyStrong buy
Oscillators
Neutral
SellBuy
Strong sellStrong buy
Strong sellSellNeutralBuyStrong buy
Summary
Neutral
SellBuy
Strong sellStrong buy
Strong sellSellNeutralBuyStrong buy
Summary
Neutral
SellBuy
Strong sellStrong buy
Strong sellSellNeutralBuyStrong buy
Summary
Neutral
SellBuy
Strong sellStrong buy
Strong sellSellNeutralBuyStrong buy
Moving Averages
Neutral
SellBuy
Strong sellStrong buy
Strong sellSellNeutralBuyStrong buy
Moving Averages
Neutral
SellBuy
Strong sellStrong buy
Strong sellSellNeutralBuyStrong buy
Displays a symbol's price movements over previous years to identify recurring trends.
Frequently Asked Questions
The current rate of NOKJPY is 14.372 JPY — it has decreased by −0.15% in the past 24 hours. See more of NOKJPY rate dynamics on the detailed chart.
The value of the NOKJPY pair is quoted as 1 NOK per x JPY. For example, if the pair is trading at 1.50, it means it takes 1.5 JPY to buy 1 NOK.
The term volatility describes the risk related to the changes in an asset's value. NOKJPY has the volatility rating of 1.03%. Track all currencies' changes with our live Forex Heatmap and prepare for markets volatility.
The NOKJPY showed a −0.13% fall over the past week, the month change is a 0.28% rise, and over the last year it has increased by 8.81%. Track live rate changes on the NOKJPY chart.
Learn how you can make money on rate changes in numerous trading ideas created by our community.
Learn how you can make money on rate changes in numerous trading ideas created by our community.
Currencies are usually traded through forex brokers — choose the one that suits your needs and go ahead. You can trade NOKJPY right from TradingView charts — just log in to you broker account. Check out the list of our integrated brokers and find the best one for your needs and strategy.
When deciding to buy or sell currency one should keep in mind many factors including current geopolitical situation, interest rates, and other. But before plunging into a deep research, you can start with NOKJPY technical analysis. The technical rating for the pair is sell today, but don't forget that markets can be very unstable, so don't stop here. According to our 1 week rating the NOKJPY shows the buy signal, and 1 month rating is buy. See more of NOKJPY technicals for a more comprehensive analysis.