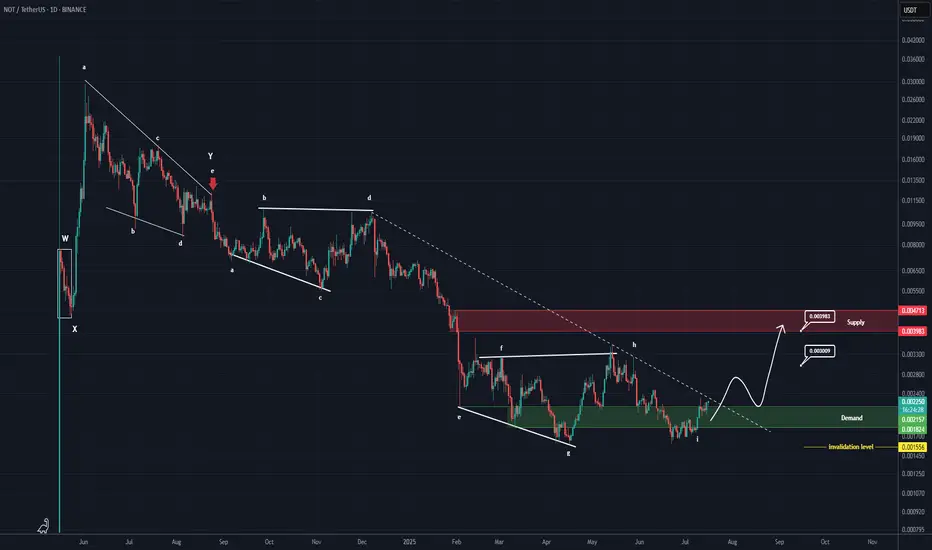
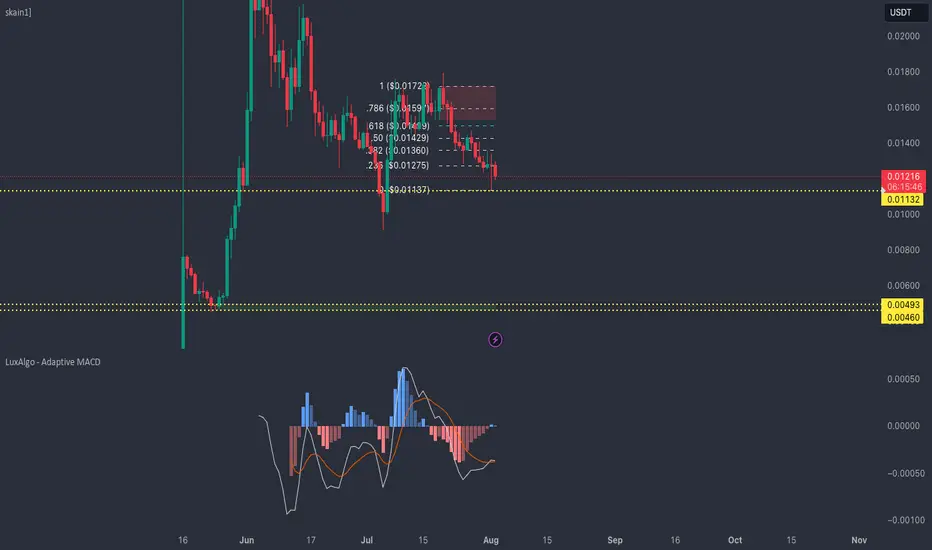
NOTCOIN New Update (1D)From the point where the red arrow is placed on the chart, the correction labeled as NOT has started.
The correction appears to be a symmetrical one, which now seems to be coming to an end. The current upward wave could be the X wave.
In previous analyses, we had also considered the structure to be symmetrical, but on a larger degree. However, based on the data currently available, it seems that the degree of this symmetrical structure is smaller.
If the price holds above the green zone, it may move toward the targets and the red box. The targets are marked on the chart.
A daily candle closing below the invalidation level will invalidate this analysis.
For risk management, please don't forget stop loss and capital management
When we reach the first target, save some profit and then change the stop to entry
Comment if you have any questions
Thank You
NOTUSDT trade ideas
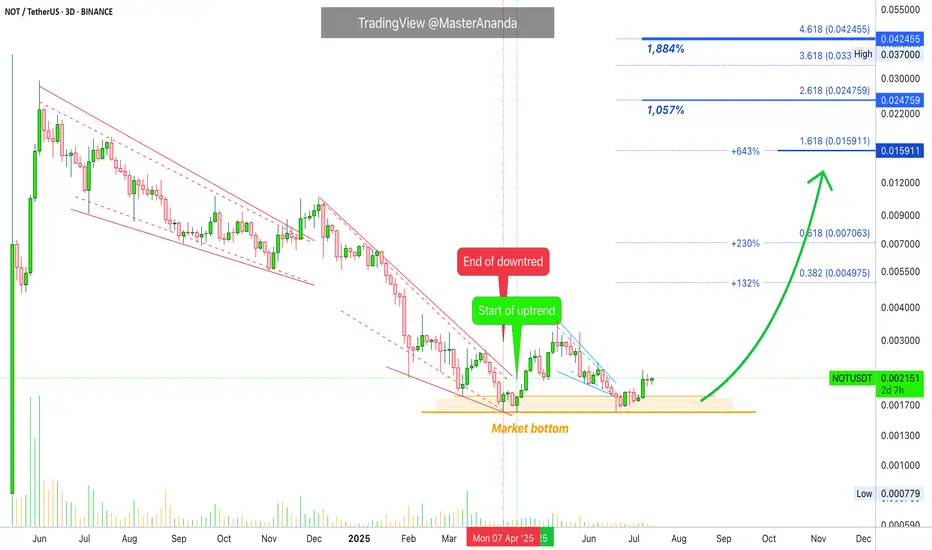
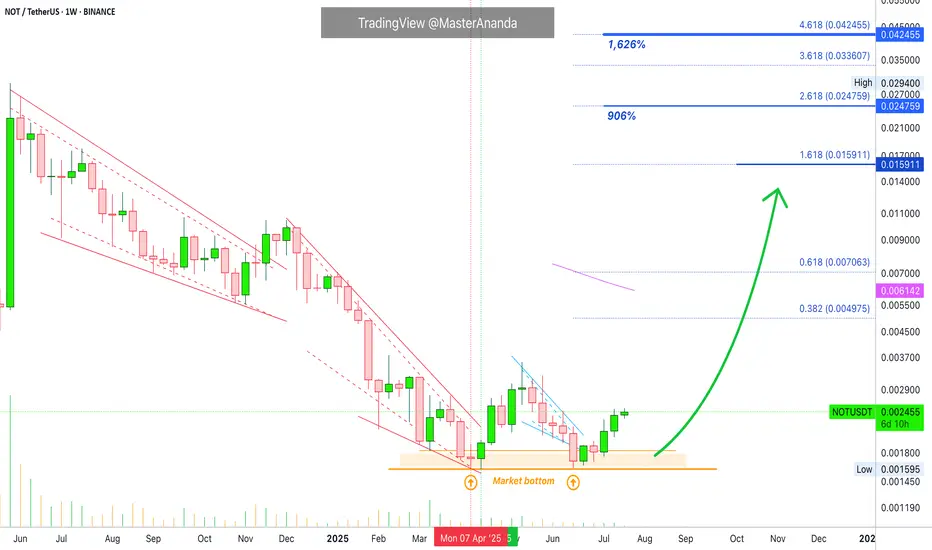
Notcoin 1884% BullishWave · Conservative Target · Will Go HigherThe first very easy target for Notcoin in the coming days will give you 230%, which is amazing because we only saw something similar in May 2024 and rather than just the start it was the end.
Then higher Notcoin will move, 100% certainty, to give you 640% profits or more. This is still easy and short-term, within 30 days or a month. Can extend a bit but there is more.
Long-term for us is within 6 months and this is the time-horizon for all targets on this chart to hit. Very easy indeed. We have 1,057% and 1,884%. Nothing extraordinary, in fact, these are just conservative projections. Notcoin is likely to move much higher in the coming months.
We looked at this pair and recommend 7X to maximize profits, it still isn't too late. If you do decide to approach this market with leverage after reading this, remember to consider the potential risks. Leveraged trading is for experts only and can result in total loss. I cannot be held responsible for your actions. If you lose money and I am responsible, then I am responsible also for any and all wins. But, we are all adults.
This is not financial advice. Just my opinion based on more than a decade of experience with charts, trading, Crypto and Bitcoin. This is not financial advice but you can bet your house that Crypto is going up. Time is running out, Notcoin will be really strong in this bull market. Do what you have to do to take advantage of this information. You will be happy with the results.
Thank you for reading.
Namaste.
The Truth About Notcoin · Still Trading At Bottom PricesDid you miss Notcoin's bullish wave? No you didn't because it is still very early in this game. This is the beauty of the Cryptocurrency market, you can even wait for confirmation and still have access to countless opportunities.
I just showed you some charts for Cardano, XRP, Ethereum, Solana and others. What difference do you notice between those and Notcoin? Yes you guessed it right; the former are trading very high up while the latter is still trading at bottom prices.
Notcoin is still trading at "opportunity buy zone" prices because the action is happening below its May 2025 high. The trading is also happening below EMA55 and in this instance this means that it is super early. Early not bearish because we know the market is moving up based on Bitcoin Dominance Index (BTC.D), Bitcoin and the Altcoins. Everything already confirmed what we have been predicting for months.
So, NOTUSDT is set to produce a 20-30X strong bullish wave. The market is making this clear and is asking you, what will you do? How can your life change with this information that you have ahead of the masses?
While for you it might be the norm to know that "Crypto is going up," many, many people are still unaware, millions of people, and they will only join the market when prices are trading 500% to 600% up. After this we would still have the bull run.
Since you are reading this now, you have great timing and you are ahead in this game. But this opportunity buying zone won't be available for much longer, it will be gone in a matter of days. Some pairs will give us at least a few weeks to buy low, the rest of the market will start to move ahead and just several days from now, marketwide bullish action will be the norm.
You know the future in advance. Take action. Make it happen. You can change your life for the better. You can produce outstanding results.
You have what it takes to succeed in this game.
Plan ahead and you will be able to collect huge profits.
It is better to hold several projects long-term rather than switch around between pairs. Just a friendly advice.
Thank you for reading.
» Beginners should simply hold, watch and read.
» Experienced market participants should trade.
» Experts should be using leverage and pyramiding.
This is the opportunity we've been waiting for.
Namaste.
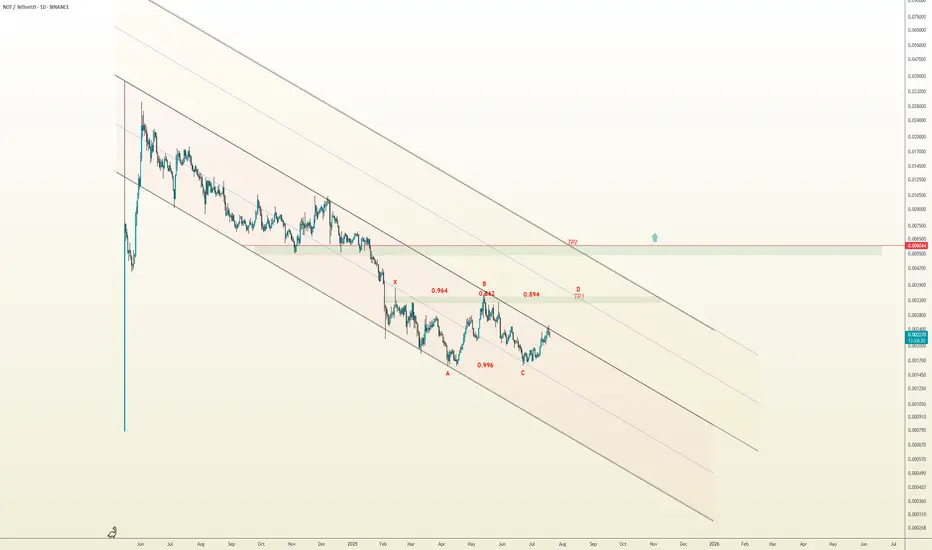
Notcoin and the Butterfly Effect
🦋 Bullish Butterfly Pattern Forming | NOTUSDT Analysis
A potential Bullish Butterfly is unfolding on NOTUSDT:
X to A: initial decline
A to B: ~94.3% retracement
B to C: higher low at ~99.6%
C to D: projected bullish leg toward 0.00327 (127.8% Fib), aligning with midline of the yellow descending channel
The price is currently testing the top of the red descending channel.
If bullish momentum holds and this upper boundary breaks, we anticipate a continuation toward point D, and potentially toward 0.006044, the upper yellow channel — a highly critical resistance. A breakout and close above this level may trigger the beginning of a major bullish trend.
🔸 Risk Management:
• Consider partial profit-taking near the midline of the yellow channel
• Trail stop-loss as the price nears point D
• Use only 1% of capital per position
⚠️ Key Note:
• If price breaks below point C, this bullish butterfly setup becomes invalid
Not to 0.0075 this monthNotcoin
Notcoin is the first crypto "clicker" game on TON blockchain.
Everything is clear on the chart.
It's time to fly.
I wish everyone abundant profits.
Like and follow
for more.

NOT/USDT Technical Analysis – Bullish Setup
📈 NOT/USDT Technical Analysis – Bullish Setup Within Ascending Channel
Notcoin has broken out of a historically strong resistance zone and successfully retested it, forming a clean ascending channel structure. This setup suggests growing bullish momentum and offers multiple trade opportunities depending on your risk profile.
🟢 Scenario 1 – Aggressive Entry:
Enter now with a stop-loss at 0.0021 and target the channel top (~0.00488). This setup offers a favorable 1:2 risk-to-reward ratio.
🔴 Scenario 2 – Conservative Entry:
Wait for a confirmed breakout above the red resistance box. If price closes above this zone with strong volume, consider entering long with a stop below 0.00244 and the same target.
📌 Price action within the red resistance box will play a crucial role in determining whether the current uptrend continues or stalls. Failure to break above this zone decisively could lead to a short-term correction before potential continuation.
💬 Which entry strategy fits your style? Let me know below.

$NOT Trade Setup 4H Chart. GETTEX:NOT Trade Setup (4H)
- Long Entry: CMP
- Stop Loss: 0.001965
- TP1: 0.002272, TP2: 0.002453, TP3: 0.002675
Retest of trendline support.
Low leverage.
DYOR. NFA.

NOTCOIN AGAIN ...Hello friends
Due to the change in the bearish structure and the weakness of the sellers, you can see that the buyers entered and were able to create new ceilings.
Now, according to the trend, we can buy in steps at the specified support points and move with it to the specified targets.
*Trade safely with us*

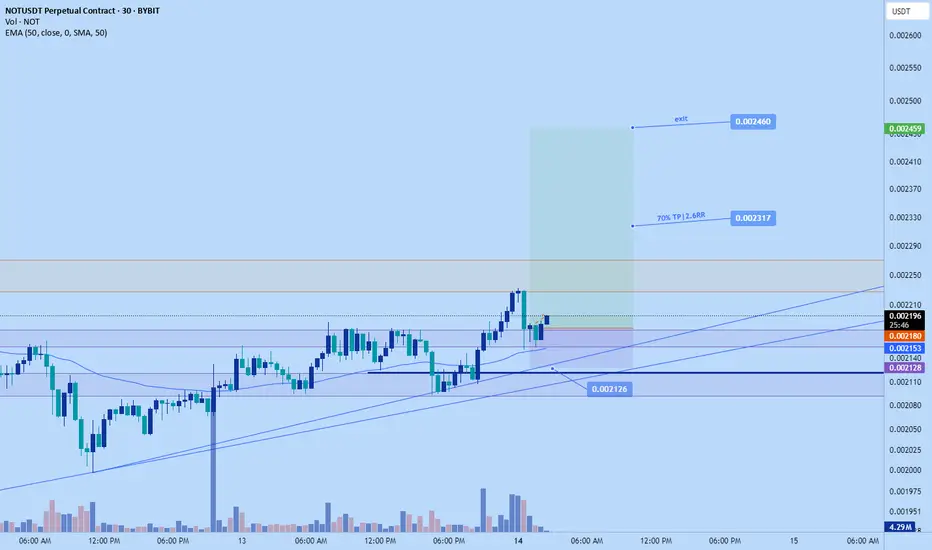
Notcoin long to $0.002460Just recently opened up a long position on notcoin.
Aiming for $0.002460
Tp 1 at : $0.002317
Tp2: $0.002460
Stoploss: 0.002126
Notcoin short to $0.002035stop: $0.002181
TP: $0.002035
Roughly 2RR
Market is high and I think its more likely to correct a bi lower before pushing higher

NOT Poised for 28% rally: can 0.0023 hold firm?Hello and greetings to all the crypto enthusiasts, ✌
All previous targets were nailed ✅! Now, let’s dive into a full analysis of the upcoming price potential for Notcoin🔍📈.
NOT is currently trading near the upper boundary of a well-defined and respected daily channel, aligning with a strong support zone. Price action suggests a potential breakout to the upside, with a projected move of at least +28%, targeting the 0.0023 level. A clean break above resistance could confirm bullish continuation in the short to mid term. 🚀
🧨 Our team's main opinion is: 🧨
Notcoin is testing the top of a strong daily channel, and I'm eyeing a breakout with at least +28% upside toward the 0.0023 target if resistance gives way. 📊
✨ Need a little love!
We put so much love and time into bringing you useful content & your support truly keeps us going. don’t be shy—drop a comment below. We’d love to hear from you! 💛
Big thanks , Mad Whale 🐋

Notcoin: The Market Always Changes Direction, Change of TrendIt is amazing, people tend to give up right before the market is about to change. I am not blaming anybody because I can fully understand. I sold everything November 2022, truly at the market bottom, but life conditions didn't allow for anything else, so I can understand those that are in a similar situation. I can see many people giving up, folding everything, selling, closing, leaving, right at the market bottom; right before the market is about to turn.
It does happen and nothing can be done about it but normally we go through this experience just one, or twice, or thrice but not forever more. Yes, we can give up because things just seen hard or even impossible but everything changes for the better when you least expect it.
When the worst is reaching its end, it gets really bad, pretty bad... In this market, a major crash, a flush and when you think you can't take it anymore it happens that you are witnessing the bottom.
Please, do not give up. If you must, go ahead... Take a break, recharge and come back. if you have the chance to stay around and stick around for a few more months, the market will reward you for your patience and persistence... Nobody said it was going to be easy, but once the positive side materializes it will be worth the hard work.
Anyway... Here we are looking at Notcoin once more. A new all-time high for sure.
I never take into consideration the first candle, the launch date because this date can be incredibly wild. I just don't trust the high and the low. But there is a high 2-June and based on this high I am certain we will get a new all-time high. This is my guess only of course, my opinion but it is based on years of experience.
Without a new all-time high we have 1,400% profits potential from current price. With 5X, you get 7000%. With 8X...
I mean, high risk vs a high potential for reward, that's leveraged trading, but you can always approach this pair spot with minimum risk and still, an amazing potential for huge rewards.
Never give up. Don't give. I don't give up, I can't understand what the word means anyway.
Yes, when it gets really hard... Just right around the corner, the next step, that's when you are closer to success. If you give up today, it means the goal could have been reached the next day. So never give up, you never know when everything will change right when the sun comes up.
We are already here... It is already happening....
You can count with my continued support. Forever and then some more.
Thank you for reading.
Your comment is appreciated.
Let me know what you think.
Namaste.

NOT NOT - Im hereNOT looks soo tired. ultimately shall complete the patterns on the top! Huge flows tho

NOTUSDT UPDATE 07/02/25Liquidity cluster above: A significant band of liquidation levels exists above 0.00178–0.00180, where market makers likely enticed longs and are now ready to reverse.
Thin liquidity zones below: The area from 0.00174 down to 0.001675 has less dense heat, suggesting an easy path for a quick move down.
Last price reaction: Price recently tagged upper high-liquidity levels, followed by rejection and an initial roll over.

NOTUSDTmy entry on this trade idea is taken from a point of interest below an inducement (X).. I extended my stoploss area to cover for the whole swing as price can target the liquidity there before going as I anticipate.. just a trade idea, not financial advise
Entry; $0.001675
Take Profit; $0.002677
Stop Loss; $0.001499

NOTUSDT 2D AnalysisNOT ~ 2D Analysis
#NOT This trade is very high risk. Buy if you still have confidence in this coin. With a short term target of at least 15%+.

Notcoin, Get Ready For A New Bullish Wave; Never Give Up!You know these two tend to move together, Dogs and Notcoin. Also notice the strong similarities between the two charts.
Just for reference, DOGSUSDT I shared just a few minutes ago.
Past action
NOTUSDT (Notcoin) grew 125% as the initial bullish breakout in less than 1 month, 28 days. After the 7-April bottom. Here there was a double-bottom with the exact date being 16-April for the start of the last bullish move. The peak happened 14-May.
Back to basics
Current price action is trading within a strong higher low and the timing is right, the market is red.
Notice the need, the compulsion almost to buy when prices are low. Ahhhh, low, that's awesome. It is the best time to buy if what you want is profits, money, success. If you want the rush, losing money and stress, buy when prices are high and there is lots of hype.
If you want profits, success and growth, buy now when prices are low. I cannot stress this enough.
Where to next?
Very easy targets here we have 155% and 261%. Notcoin already grew 125% and remains within a strong higher low, this means that a higher high is mandatory next and it will happen, with a high level of certainty; this is sure, this is easy, it is just the way it is, it is how the market works.
First, you get a downtrend and there is always tons of red. Second, the market turns green and it always goes up. Both within the uptrend and downtrend you have bearish and bullish moves, only the bigger picture doesn't change. So you do get corrections in a bull market, periods of red but these tend to end just to produce more growth. This is what we are seeing today but only the start.
I can understand that many people are new to this market, to these pairs, to these charts; and so, there isn't much to go by. Notcoin has been trading only for a few months. But trust from someone with more than 10 years of experience in this market, since 2013, the next market phase is a major advance and it will be something like you've never experienced before.
In short, we are going up.
The time is right, the time is ripe. Prices are great.
Never give up
Genius and successful traders tend to buy when prices are low. Prices are low now.
I know it is hard to take the plunge, to move forward, to go ahead; but that is how it works.
If you want easy profits, sure profits and winning long-term, you have to detach from the herd mentality and move according to tested knowledge rather than impulsive buying.
How easy is to buy when everything is up?
Right now, instead of buying some people are actually thinking of selling, giving up. Never give up.
If you didn't sell when prices were high, why would you sell when prices are low?
Buy and hold
Better yet, buy and hold.
If you miss the next top, that's ok, keep holding long-term. But never sell at the bottom, it is a recipe for disaster; we all make mistakes.
If you are plagued by mistakes and you can't seem to get it right, never give up.
Go out and do some walking, running or whatever, when you comeback, you will be ready for more.
The market is not going away, there is a fortune here waiting for you, you have to prepare and the market will give you as much as you can take.
Thank you for reading.
Namaste.

We draw a pennant on the semi-annual chart
It is important to note that we are completing the movement along the pennant formed on an earlier rebound, which, in my opinion, is a bullish signal.
I actively buy more whenever possible.
The news background is twofold: the exchange was recently hacked, 3% of the entire coin issue was withdrawn, we are still declining on this news at the moment (it did not win back), but the hackers withdrew coins from the exchange crookedly to the wrong wallet (the coins "burned out", consider them not for anyone), the exchange will redeem at its own expense This volume of coins will be removed from the market, which will significantly reduce the circulating supply, and this is an advantage for the price. Coins are increasingly concentrated in the hands of whales, hamsters have lost everything, passengers have been disembarked, we are waiting for the Fed rate cut, we are flying to the altseason, and only then into recession, but that's another story.

Phemex Analysis #90: Pro Tips for Trading Notcoin (NOT)Notcoin ( PHEMEX:NOTUSDT.P ) is rapidly becoming a standout token in the Web3 gaming sector, supported by a massive and highly engaged community comprising 13 million Telegram subscribers, 35 million game players, and 6.2 million active wallets. This impressive scale positions Notcoin as one of the largest gaming platforms in the Web3 space.
Recently, Notcoin has announced ambitious plans to enhance and expand its gaming ecosystem, making its existing popular games just a starting point for a much broader suite of offerings. This strategic expansion is designed not only to retain existing players but also to leverage Telegram's extensive user base to continually attract new users.
Furthermore, the introduction of innovative games and fresh reward mechanisms aims to build a more sustainable and enduring play-to-earn model, reducing dependency on short-lived hype and laying down foundations for consistent long-term growth.
Given these exciting developments, let's explore several possible trading scenarios that could unfold in the coming days.
Possible Scenarios
1. Breakout Rise Above $0.0032 (Bullish Scenario)
If Notcoin manages to maintain a stable footing above the critical support at $0.002, it could validate a clear "cup and handle" formation—a widely recognized bullish reversal pattern. A decisive breakout above the resistance level at $0.0032, especially if accompanied by strong trading volume, would signal the potential start of a significant bullish move.
Pro Tips:
Entry Strategy: Consider entering or scaling positions only once the breakout above $0.0032 is confirmed with substantial trading volume.
Short-Term Targets: Aim to take partial profits near key resistance zones at $0.0065 and $0.0084 to lock in gains effectively.
2. Retesting the $0.0016 Support Level (Neutral Scenario)
If the $0.002 support level fails to hold firmly, Notcoin’s price could pull back toward a critical lower support at $0.0016. Monitoring trading volume at this stage is crucial—if the decline occurs on low volume, it may indicate a temporary shakeout rather than sustained bearish pressure.
Pro Tips:
Volume Analysis: Pay close attention to trading volume. Low volume during a retest of $0.0016 would suggest weakening selling pressure and potential rebound.
Cautious Accumulation: Consider cautiously accumulating positions only after seeing clear stabilization around $0.0016.
3. Bearish Drop Below $0.0016 (Bearish Scenario)
Should Notcoin breach the crucial support at $0.0016 accompanied by high selling volume, this could signal significant bearish momentum. In this scenario, traders should exercise extreme caution and avoid immediate long positions.
Pro Tips:
Market Observation: Step back and remain cautious; staying on the sidelines could prevent unnecessary exposure to further declines.
Risk Management: Wait patiently for clear bullish reversal signals before re-entering the market or accumulating positions again.
Conclusion
Notcoin (NOT) is at an exciting yet pivotal moment, backed by robust community engagement and an evolving, sustainable gaming ecosystem. Traders should carefully monitor the outlined technical scenarios, apply disciplined risk management strategies, and keep a keen eye on trading volume as a key indicator. By approaching Notcoin strategically, traders can effectively navigate volatility, optimize potential rewards, and confidently capitalize on opportunities as they unfold.
🔥 Tips:
Armed Your Trading Arsenal with advanced tools like multiple watchlists, basket orders, and real-time strategy adjustments at Phemex. Our USDT-based scaled orders give you precise control over your risk, while iceberg orders provide stealthy execution.
Disclaimer: This is NOT financial or investment advice. Please conduct your own research (DYOR). Phemex is not responsible, directly or indirectly, for any damage or loss incurred or claimed to be caused by or in association with the use of or reliance on any content, goods, or services mentioned in this article.

NOT/USDT – Bullish Breakout Setup!!NOT Breakout Alert – 60% Potential on the Table
Hey Traders — if you're into high-conviction setups with real momentum, this one’s for you.
NOT has broken out of a descending triangle after weeks of consolidation, showing strong bullish potential ahead.
Pattern: Descending Triangle Breakout
Breakout Level: 0.00245
Previous Move: 66% rally before recent correction
Entry: Breakout above descending trendline
Stop-loss: Below recent support near 0.00222
Target: 0.00390+
Technical Outlook:
Clean breakout after sustained downtrend
Structure favors continuation to the upside if breakout holds
Volume confirming breakout strength
Risk-reward ratio remains highly favorable on this setup. Watching for continuation as long as price holds above breakout level.

NOTcoin: Where can we buy it? I wrote to you...Hello friends🙌
🔊Considering the price drop we had, you can see that the price has finally found support, but our channel has been broken, and the indicated supports are good points for buying in steps and with capital and risk management...📈
🔥Join us for more signals🔥
*Trade safely with us*

Notcoin Updated Targets, Now 3,150%+ Potential Profits & Higher Notcoin's higher low is being confirmed right now; a second chance, a new entry zone.
This is a double higher low. The first one came in vs 10-March, the second one vs 7-April.
5-June 2025, Notcoin ended its small retrace which only lasted 22 days. Now that the retrace is over, we can aim up, aim high while updating our targets. See the difference:
» The first target, a very strong one now gives 725% potential for profits, from this point forward (current price).
» The second target is an amazing 20X+ or 1946%, wow. It gets better.
» The third target on this chart peaks at 3167%, this is huge and only time will tell if Notcoin (NOTUSDT) will go that high but I get the feeling it can go even higher.
The market always offers a second chance, but I don't think there will be a third. You can buy now or be left out. This is the start of the 2025 bull market. The last chance you will get.
Thank you for reading.
Your support is appreciated.
Namaste.
