#NOT/USDT is forming the Symmetrical Triangle Pattern in 1-hour #NOT/USDT is forming the Symmetrical Triangle Pattern in 1-hour TF!
Wait for BO/retest to long it. GETTEX:NOT local resistance level is PWH $0.01642. The local support level is PDL $0.0137.
NOTUSDT trade ideas

#NOTUSDT: Second Update, Still Expecting A strong Bullish Move! Dear Traders,
Previously we had advised to buy BINANCE:NOTUSDT , however, price fell below our entry zone, this is just an update based on previous analysis. We expect price to grow from current price point towards upside and then drop to fill the gap within the market. This is where we can enter a swing entry, taking price to all time high.
Good Luck and Trade Safe!

Notcoin (NOT) price analysisNotcoin (NOT) saw a 62% rally over the weekend after the 40% drop over the past week. The price of Notcoin is now higher than it was on Monday, the 1st of July.
Additionally, it was accompanied by a large increase in trading volume, with the daily volume soaring by just over 300% on Sunday, the 7th of July.
The effect of Bitcoin’s (BTC) bearish sentiment last week showed strong signs of wearing off.
The 6-hour chart of Notcoin showed that the token has been in a retracement phase since the second week of June. The Fibonacci retracement levels saw the 50%, 61.8%, and 78.6% levels tested as support.
The final one was defended over the last few days even though the market-wide sentiment was bearish. The increased trading volume during the price bounce was also encouraging. This bounce saw Notcoin break the bearish market structure and also the trendline resistance.
The Bollinger bands began to expand to denote volatility, and the RSI was above neutral 50. It is expected that NOT can continue its uptrend to reach $0.03 in July, but this is dependent on BTC’s trend too.
Thus, we can conclude that in the short-term, futures traders are getting more eager to go long on Notcoin, which proves its bullish perspective in the nearest term.

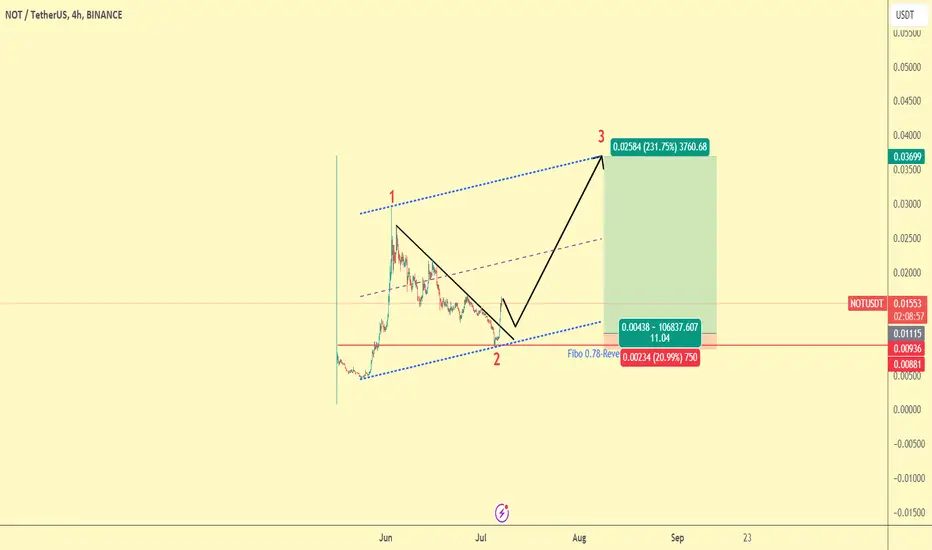
Notcoin-Wave 3 started-Huge Volume !!!Dear Traders,
Not coin had Deep Correction , reversal Candle (0.78 fibonacci)
i expect Wave 3 started , and Notcoin have potential more than 300% Gain !
First Target : 0.023000
Second Target : 0.035000
Third target : 0.0650000
SL : below Reversal Candle,
Dont Forget like&Comment please !
Regards,
Alireza
NOTCOIN BULLISH TENDENCIESLooking at the current direction and analysis of the market you can see the possibility of price to continue upwards. There is a break of structure and a sign of upward continuation looms.
Also there's a Possibility of a downward spiral because this is a new project and the fundamentals are still not very solid. we can see users taking minimal profits as the see little to no profits.
LET'S WATCH AND SEE HOW THIS PLAYS OUT!!!


NOTUSDT (Notcoin) Long Swing IdeaAs there are tons of coins are collaborated with telegram and going to be listed over TON network, as the altcoin of the TON, Notcoin will be gaining more and more value.
Rather than fundamental part, if we look on the graphs, we see the trendline is broken and the price went up, as well as, fibonacci golden zone is respected which helps us think bullish at this part and the possible upwards move will be as much as it was after the listing.
Good Luck to everyone! I'm so much Bullish about this coin📈🙌🏽💵

NOT PlanNOT looks good for a short here!
Planning to add a position after sweeps the liquidity, aiming to short into the discount. The first target will be at least 50% of the new Fair Value Gap (FVG) created, and then hopefully the last level below.

Notcoin
* In the past 24 hours, Notcoin's price has surged by over 35%, indicating strong bullish momentum in the short term.
* Trading volume has also increased significantly, suggesting that institutional investors may be accumulating Notcoin.
* The Relative Strength Index (RSI) is currently in overbought territory, which could signal that a correction may be imminent.
* However, the Moving Average Convergence Divergence (MACD) indicator is still bullish, indicating that the uptrend may continue in the near term.
* Overall, while the short-term trend is bullish, investors should exercise caution and monitor key support and resistance levels to manage risk.

NOT the right time...Looks like we going down (elliot wave) expecting NOT going back to atleast 0.01555, when reached we will look for a new trade if NOT might go long.
Always DYOR, this is no financial advice.

BULLISH CONTINUATION BYBIT:NOTUSDT Has broken a significant trendline on the bullish wedge pattern which makes it a very significant movement for the price of Notcoin. As we can see the price of NOTCOIN has fallen by 75% from it's All time high of $0.035 to $0.009. Also in the course of this price drop, we could see the formation of a bullish wedge pattern which break above it on Saturday and we are currently trading within the range of $0.016 and $0.017.
For anyone looking to buy $NOTCOIN right now I suggest you wait for the price to retest the breakout around the price levels of $0.011 and $0.012, before we can start looking for buy positions..
NOTE! : THIS IS NOT A FINANCIAL ADVICE IS JUST FOR INFORMATIONAL AND EDUCATIONAL PURPOSE ONLY, DO YOUR OWN RESEARCH THANKS.
-PLEASE DO FOLLOW BOOST AND LIKE FOR MORE DAILY UPDATES.

Notcoin (NOT): bullish rebound coming?NOT, a Telegram-based cryptocurrency, has seen a significant gain of 6% over the past day following the market rebound. The altcoin hovers above $0.016, indicating a strong upward trend in its trading patterns.
As of this writing, Notcoin price is $0.0164, surging 22% during European trading hours.
Notcoin is currently showing signs of a robust recovery, potentially signaling the onset of a bullish trend. Notcoin could break through the $0.016 resistance barrier if this momentum continues. This upward move propels its price towards $0.02 and could reach as high as $0.1 in the near future.
On the flip side, if the market sentiment deteriorates, Notcoin might stabilize around the $0.015 support level. In a sustained bearish phase, the price might drop to about $0.014. These fluctuations highlight the inherent volatility within the cryptocurrency market.
The 4-hour technical indicators for Notcoin (NOT) show a recent rebound after a continuous downward trend. The Relative Strength Index (RSI) indicates a value of 65.72, moving above the neutral 50 level, suggesting a growing bullish momentum. The RSI’s recent rise from a low of 69 points towards increasing buyer interest.
The Moving Average Convergence Divergence (MACD) has begun to show promising signs of a bullish crossover. The MACD line (blue) has moved above the signal line (orange), signaling a potential upward movement in price. The histogram also supports this outlook, transitioning from negative to positive bars, indicating a shift in momentum toward the buyers.
The Average Directional Index (ADX) remains high at 48.29, indicating a strong trend in the market.


Sideways movement to go further for upward movementExpecting NOT to go atleast to 0.01645 to follow the trend line and go up from there. If not breaks through it might go down further 0.0158
DYOR! This is no financial advice.

NOTCOIN Up 85% In Four Days. Targets & Trade Strategy.Traders,
So, two days after recommending, NOT coin had one last liquidation event before popping up and out of this bullish descending wedge nicely. It then proceeded to rally 85% from its wick low to its current price as of this post and a full 35% from where I recommended entry!
As I’ve stated previously, altcoins are few and far between right now for long entries. But there are a few you’ve heard me mention which have good setups. NOT coin was one of these and is why I entered initially.
If you are still looking to re-enter this coin, 15 cents appears to be a great level. You will see that volume has created a nice level of support at that price.
For those of you still in the trade, I have drawn four levels above my entry, the first level we’ve already hit at 15 cents. Target two comes at around 19 cents. Target three at 21. The final target is 25 cents plus.
Best of luck to you all!
Stay tuned and I’ll do some more analysis on some of my other recommendations, like BONK, up 15% today so far.
Stew

LONG #NOTUSDT1m TF. The asset is NOT one of the leaders in terms of trading volumes (2 billion) with upward movement dynamics. High activity on the part of buyers is manifested in price compression to the local resistance level. I expect the continuation of the upward structure and the breakdown of the marked level with a good risk-profit ratio on the activity in the order book.

NOT Flashes Bullish Power Scalper Signal On The 4H Chart — 17% PCurrent Status 📊
GETTEX:NOT has delivered an outstanding performance for the last few days. However, the rally might continue based on the latest Power Scalper signal.
The Signal ⚡️
NOT flashed the signal on the 4H chart, indicating a potential of more than 17%. Unfortunately, there is not enough data to provide solid backtest data for NOT. Nevertheless, the signal generally has solid reliability on the 4H chart.
What About The Chart 📉
The signal fits perfectly into the current chart setup: The profit potential points to the resistance at $0.02. Therefore, the idea of the current signal is to ride the wave back to the resistance.

NOTCOIN (NOTUSDT): Back to Bullish Trend?! NOTCOIN is showing signs of a recovering after a prolonged period of bearish activity.
There has been a clear breakout above a significant daily resistance level, indicating strong buying pressure.
I anticipate that the market will continue to recover and potentially reach the 0.021039 area in the near future.

$NOT - Bullish FlagNOT brokeout from bullish flag formation and looks like the retest already done.
Bullish for me and I am loiking for a good entry for long position at around 0.016132 - 0.014990
Always dyor and use stop loss whatever your position

What Happens in NOTCOIN?By carefully examining the chart of Notcoin, we can see the movements of whales so that they can own more circulating tokens , for this reason, I have a bullish view on this currency and I hope it reaches its first target.
For more explanation, I would like to say that creating a trap for buyers to hesitate and rush to buy, as well as creating fear for sellers and owners of Notcoin currency to sell, is a sign of an upswing and new Bullish Impulsive Leg.
Be patient and good luck

NOT coin analysis → after breakinghello guys.
poof! What a week!
apart from other coins, NOT coin was great and broke the descending channel.
it is forming a knife-up pattern RN! and we can expect another upward movement toward the next channel!
the blue area is assumed as target!
___________________________
✓✓✓ Always do your research.
❒❒❒ If you have any questions, you can write them in the comments below, and I will answer them.
❤︎ ❤︎ ❤︎And please don't forget to support this idea with your likes and comment


NOTHING !!BINANCE:NOTUSDT
The reasons I mentioned in the analysis before, the price increased after the wedge broke, and after the price correction wave, can reach the next targets.
✨Traders, if you liked this idea or have your opinion on it, write in the comments, We will be glad.
_ _ _ _ __ _ _ _ _ _ _ _ _ _ _ _ _ _ _ _ _ _ _ _ _ _ _ _ _ _ _ _
✅Thank you, and for more ideas, hit ❤️Like❤️ and 🌟Follow🌟!
⚠️Things can change...
The markets are always changing and even with all these signals, the market changes tend to be strong and fast!!
