NOT USDT SHORTnext idea to go short in this cripto, good luck and too this is the last of the year, like and follow
NOTUSDT trade ideas

150% Profit📊Setting a trading signal based on price levels involves identifying key thresholds that can trigger buy or sell actions. Here’s how you can set signals for the NOTUSD asset based on the provided price levels:
✅Buy Signal:
Entry Point: Consider buying when the price is around 0.0066. This level seems to be a lower support point, offering a potential entry for a bullish move.
Confirmation: Wait for additional confirmation, such as a price rebound or positive volume increase, to ensure the support holds.
🟢Take Profit Signal:
First Target: Set the first take-profit level at 0.0087. This represents a significant price increase from the entry point.
🟢Second Target: The next take-profit level could be at 0.01689, which aligns with the higher price range mentioned.
🔴Stop Loss Signal:
Risk Management: Place a stop-loss order slightly below the entry point, around 0.0054, to minimize potential losses if the price moves against your position.
Sell Signal:
Exit Point: If the price reaches 0.000505 and shows signs of reversal or resistance, consider selling to lock in profits.
Re-Entry Signal:
Pullback Opportunity: If the price retraces to 0.000460 after a peak, it might offer a re-entry point for another potential upward move.
By setting these price-based signals, you can systematically approach trading the NOTUSD asset, balancing potential profits with risk management. Always monitor market conditions and adjust your strategy as needed. 🚀

NOT UPDATE#NOT has a nice pattern i think there should be another correction i think the last correction can make a divergence to the last drop and also grab lots of liq

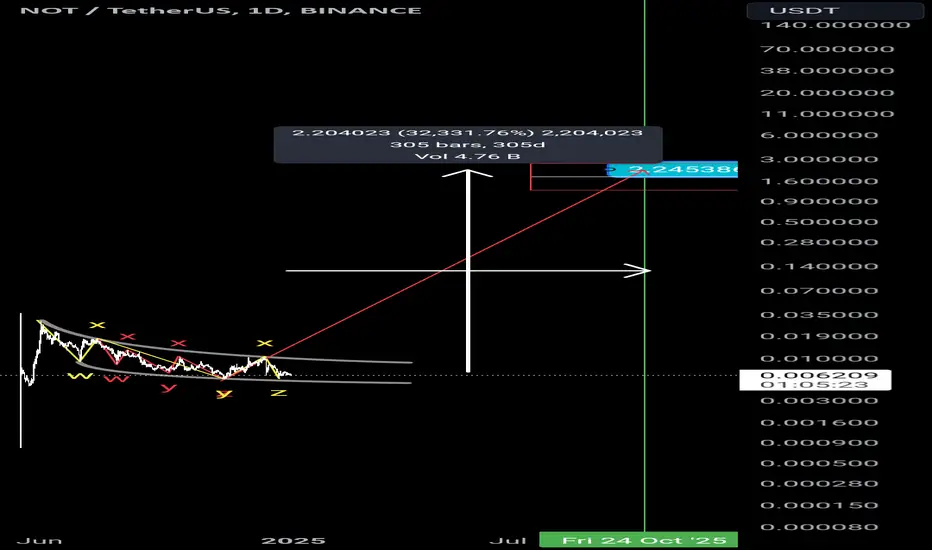
2.24 cent in 305 days Hey hodel crypto
We have a good coin for keeping
Buy that & set stop & Waite for touch target
Pay attention dont forget set stop because
Crypto have a hight risk investment
Waiting for alt season for grow altcoin
🤍
Nothing !!!The price is currently within a triangle and will reach the end of the triangle in the coming days. At that point, we should look for a position, considering two scenarios: one is that the triangle breaks upward and the price rises to the 0.382 Fibonacci line, and the other is that the triangle breaks downward and the price drops. However, we must consider the "father" of this coin, Toncoin, which plays a significant role in valuing this coin.
Give me some energy !!
✨We spend hours finding potential opportunities and writing useful ideas, we would be happy if you support us.
Best regards CobraVanguard.💚
_ _ _ _ __ _ _ _ _ _ _ _ _ _ _ _ _ _ _ _ _ _ _ _ _ _ _ _ _ _ _ _
✅Thank you, and for more ideas, hit ❤️Like❤️ and 🌟Follow🌟!
⚠️Things can change...
The markets are always changing and even with all these signals, the market changes tend to be strong and fast!!


Get Ready for More Gain: NOTCOIN Hits 0.0097 Fast!Hello and greetings to all the crypto enthusiasts, ✌
In several of my previous analyses, I have accurately identified and hit all of the gain targets. In this analysis, I aim to provide you with a comprehensive overview of the future price potential for NOTCOIN, 📚💡
NOTCOIN has recently broken through its downward trend and daily resistance levels, signaling a potential market shift. This breakout from its triangle pattern, combined with a surge in trading volume, suggests a growing bullish momentum. I anticipate further upward movement, targeting higher price levels as shown on the chart. 📚🎇
While a 47% short-term gain is expected, minor pullbacks or consolidation phases are possible, which are normal market behaviors during trend development. These fluctuations should be seen as part of the overall positive trend. 📚💡
🧨 Our team's main opinion is: 🧨
NOTCOIN has broken its downward trend and resistance levels, signaling potential bullish momentum with a 47% short-term gain. While upward movement is expected, minor pullbacks or consolidation phases may occur as part of the trend development.
Give me some energy !!
✨We invest countless hours researching opportunities and crafting valuable ideas. Your support means the world to us! If you have any questions, feel free to drop them in the comment box.
Cheers, Mad Whale. 🐋

#NOT/USDT#NOT
The price is moving in a descending channel on the 1-hour frame and is expected to continue upwards
We have a trend to stabilize above the moving average 100 again
We have a descending trend on the RSI indicator that supports the rise by breaking it upwards
We have a support area at the lower limit of the channel at a price of 0.006226
Entry price 0.006567
First target 0.006765
Second target 0.006949
Third target 0.007180

Not last drop !#NOT has a perfect pattern for a good rise in think that there is an ABC pattern which has 5 waves in the B wave like ABCDE after this ABC pattern market will rise and make a super spike up !

Not There is a small risk here based on the candle stick we can see a bullish candle with a tail and then we have a morning start pattern where my stop loss is very tight just manage your risk

LET'S RIDE THE TRAIN TO THE MOON This dude has picked up steam, it has teasted the weekly 50% retracement level and it's ready to ride the rocket to the moon, look for a strong 4h bullish candle, buy and hold some of this lady, we may not see this price again in the next 6 months. happy trading. trade with caution and grace. risk only what you are ready to lose. see you at tp

Spot BUY FOR NOTUSDTGOOD area for buy spot notcoin.
break trend line
Break and pullback on EMA50 EMA100
go up to 0.0083

Good Area For NOTUSDTspot Buy Signal for NOTcoin
Braeck Trendline
Breakand pullback on EMA50 EMA100
up to 0.0083

NOT Breakout RangeI think NOT is want finding more concept of manipulation
Soon i think price will go down to flush retail or named spring then pumping

NOTUSDT 1D#NOT has formed a double bottom pattern on the daily timeframe, and it’s expected to see some price increase from this point. The main move for NOT will happen when it breaks the psychological barrier of $0.01.
Here are its mid-term targets:
🎯 $0.008651
🎯 $0.011158
🎯 $0.014644
🎯 $0.017461
🎯 $0.020279
🎯 $0.024290
🎯 $0.029400

Not is bullish #NOT took all of its liq volumes i think maybe there should be a small correction in the market due toncoin pattern after that above liq will be targeted

NOTCOIN – the top coin in the TON ecosystem will skyrocket in 20Time to accumulate NOTCOIN now. The 2025 TON Era begins.

not is for short onlyI closed my previous set up. Will see how it will behave after bounce. Will take a look only at short set up only

NOT. USDTA rebound in the price of NOT is inevitable, but with the sharp drop in price, it needs to gain some energy.
so waiting and rebuy not bad for holders

NOT looking strongNOTUSDT seems to have confirmed its breakout and should make a move above 0.01.
Anything below 0.07 gets us back to the accumulation zone and invalidates the breakout. Until then, I see no problem in the pattern.
Cheers

Dump on smaller timeframeBreakdown of the local downtrend channel will happen after new feature release (probably on monday) - after that you will see beginning of the big dump
Good luck

Don't momentum for continue down price Long for 0.0013 price
Time zone for receiving price
27 december 2024
Set the stop & put your money management

NOTUSDT 1H – Bullish Wave 5 BreakoutHEY GUYS I HOPE YOU FIND THIS IDEA VERY WELL
Elliott Wave Structure:
Wave 1 to Wave 4 has completed successfully.
Wave 5 is now forming with momentum shifting to the upside.
Key Levels:
🎯 Target Profit (TP): 0.00874
🛑 Stop Loss (SL): 0.000763
Trendline Break:
The price has broken above the descending trendline (yellow), signaling a bullish continuation setup.
Momentum Confirmation:
Heikin Ashi candles show decreasing selling pressure and bullish momentum starting.
Trade Setup:
Entry Zone: Current breakout levels.
Take Profit: 0.00874 (Wave 5 target).
Stop Loss: Below Wave 4 at 0.000763 for a solid risk management setup.
Bias:
✅ Bullish – Wave 5 Potential Upside 🚀
⚠️ Note: Always monitor volume, confirmation, and overall market conditions for risk management.
Disclaimer: This is not financial advice. Trade at your own risk and perform your own analysis before entering any positions.
#Altseason2025 #CryptoMarket #OTHERS.D #Altcoins #CryptoBreakout #TradingViewIdeas
