NOTUSDTmy entry on this trade idea is taken from a point of interest ABOVE an inducement.. I extended my stoploss area to cover for the whole swing as price can target the liquidity there before going as i anticipate.. just a trade idea, not financial advise
NOTUSDT_EQARK5 trade ideas

Notcoin (NOT): what to expect after 8% daily growth? Currently, the NOT token is trading at $0.008277 with a 24-hour increase of 8.51%. In the past seven days, the gaming crypto token has increased by almost 12% despite the recent controversy of Telegram’s CEO being arrested.
Nevertheless, the bullish recovery in Notcoin shows an upcycle challenging the resistance trend line of a falling-wedge pattern. The gaming coin shows an intraday candle with a higher price rejection from the $0.010 psychological mark.
As the breakout chances increase, the crypto gaming token will likely reclaim the $0.002 level. Furthermore, based on the Fibonacci levels, the optimistic target for the gaming token stands at $0.03234, almost 3x gains.

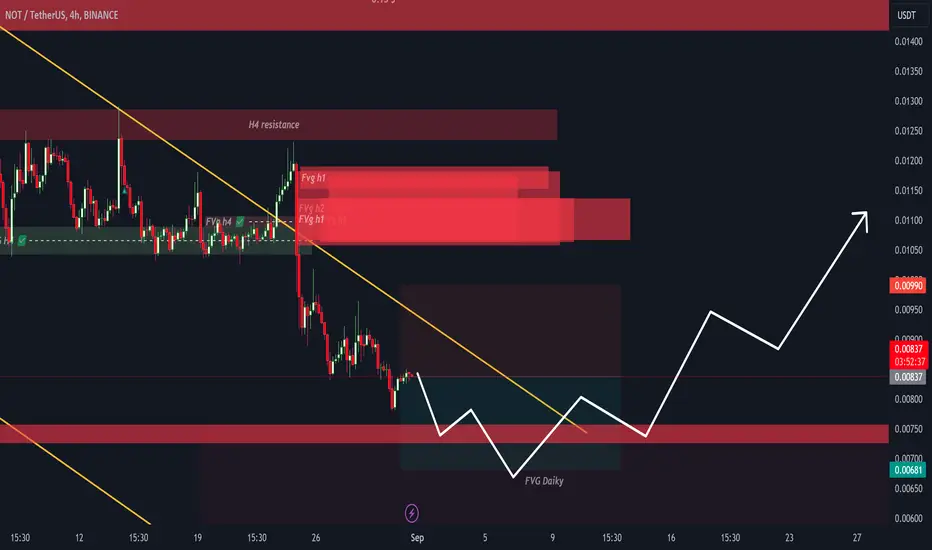
#NOTUSDT (Watchlist) 9-2024NOT is currently trading within a falling wedge pattern, with support at $0.0076 and resistance at $0.0087. A breakout above the resistance could trigger significant upside potential, with the possibility of substantial percentage gains.
When we recommend adding a coin to your watchlist, it's typically due to forming a pattern, nearing a historical bottom, or approaching a strong support level. It may also show increased trading volume, reversal candles, or be in an accumulation stage. While we haven't observed a bullish reaction yet, we advise monitoring it until an optimal entry point emerges.
PS:
We avoid trading coins associated with gambling, prostitution, human trafficking, etc.
Note:
This is not financial advice but an analysis of coin movements. Conduct your own research and practice risk management before making any investment decisions. Remember, the cryptocurrency market carries significant volatility and risks.
Best wishes to all,
we ask Allah reconcile and repay. 🙏

Bullish on $NOT1. We have price hit a major PD arrays, the weekly breaker
2. We have a run on stops
3. We have a market structure shift (MSS)
4. We have our draw as the weekly FVG High and low

NOTCOIN Bullish Wedge Pattern with $0.1 TargetNOTCOIN is currently consolidating within an extended flag-like structure or falling wedge pattern. The immediate accumulation zone marked on the chart represents a crucial area for potential buying opportunities. A significant bullish momentum is anticipated, which could lead to substantial buying pressure.
On the downside, a key demand area has been identified. This zone is considered optimal for accumulation if the price retraces to that level. We should be prepared to capitalize on any price dips to this area, as it presents a favorable risk-reward ratio.
The ultimate price target is projected at $0.1, suggesting considerable upside potential from current levels. This target aligns with the bullish outlook and the expected breakout from the current consolidation pattern.
As always, proper risk management is crucial when implementing trading decisions.

Time to buy NOTGet ready to buy NOT for 1$ target
I think a reverse triangle occur and new rally will begin.
Stoploss = 0.006$
Tp1 = 0.001$
Tp2 = 0.002$
Tp3 = 0.003$
Tp4 = 0.01$
Tp5 = 0.1$
Tp6 = 1$ doruv target

An interesting deal on notusdt for tonight's newsThere is a 90% probability of failure of this line, your entry process must be before failure

#NOTUSDT (yellow pattern )Due to the lack of data and the fake file, the Telegram manager
is a bit shaky at the moment, but
the inside of the yellow pattern is moving and
falling below this pattern is a bit bad and going above the pattern is great.
So we wait to see what he does with the yellow pattern floor

NOTUSDT Price Prediction (Update)Trend Prediction - NOT/USDT Forecasting -
Resistance and Support Lines Falling Wedge Pattern
**** Yousef Sharafi ****
Follow me here for more analysis

NOT, will 'not' leave you disappointed, Enormous Growth ahead.Notcoin is a game developed by Open Builders where players can earn in-game cryptocurrency, also called Notcoin, by tapping the screen repeatedly.
The game’s phenomenal success and Notcoin’s achievement of a $2 billion market capitalization in less than six months since launch are worth discussing.
Developed by Open Builders, a team known for creating viral social games,
the project aims to bring users into the Web3 space on The Open Network (TON) blockchain, which is directly linked to Telegram.
-------------------------
NOT has reached an All time highs recently reaching as high as 0.028, but later on corrected healthily to 0.020 base range which is holding steadily.
A new attempt has been spotted today at the current price area with high probability of an ascend continuation. A revisit to 0.028 area with a possible strong break of that peak range is high.
NOT has huge following, and volatility of this coin is very high which is a good thing (and of course, the opposite is true if you can't time your entry perfectly).
The current range is showing some good seeding opportunity.
Spotted at 0.0210
Interim target at +50%
TAYOR.

SHORT #NOTUSDT 30m TF. The asset is NOT actively declining and breaks through support levels well on history. At the moment, an active decline has formed along a small inclined triangle. I expect to see buyers' stop losses behind the two-level horizontal support. Given these facts, I consider an impulse breakdown on the activation of stops when accumulating near the level and active sales.
Closing goals: 0.007413 - 0.007372 - 0.007320 - 0.007253

How To Know When The Correction Is Over? Bitcoin TooI will show you a little trick because many people are saying things without the needed backing, nor experience.
"The correction is over" is too much of a broad term. We need first, to define correction and, second, we need to understand that not all pairs will end their correction at the same time.
Look at Notcoin, we could say the "bullish wave is over" in March 2024 but this isn't true for Notcoin, it wasn't even around on that date and surely, the bullish wave started in May and ended in June.
When Bitcoin reached a high of 74,000, the majority of the people that are saying "the correction is over," are the same people that were saying, "the start of the bull-market" and "100,000 next." All these same people could not see, not even predict but see, that Bitcoin was moving lower and it crashed on the 5th of August. The crash costed bullish traders billions of dollars, the exchanges took this money because they got it wrong.
Many people are saying that the correction is over, but this people were not able to predict the correction nor anything else for that matter, so why is it over? What makes you say that it is over? Where is the proof? With what authority do you say so? With what moral power? Based on what? Using which understanding? Where are the signals?
Whenever I make a prediction I use many different data points to support whatever I say. It is written on the TradingView rules, it says; use the data on your chart to support your bias.
You need data to support your point of view.
For example, I say it is going down and I give many signals, subtle and not so subtle that support by bias. It should be the same in reverse.
➖ How do you know when the correction is over?
When the correction is over, the Altcoins that move with Bitcoin, like Notcoin right now, will produce massive growth.
As soon as Bitcoin hits bottom, pairs like NOTUSDT, SOLUSDT, BNBUSDT, will grow so much, so fat, so strong, that it will be quite the revealing signal. That's the key.
The Altcoins that I am showing you bullish, hundreds of those, most of them ended their correction already, but they went very low, some hit new All-Time Lows and some are trading at multi-year strong support. For these, we can say, "the correction is over."
Those that are trading super-high, we have to wait... Based on the data coming from the chart and market conditions, the correction is not over, it is going down, it keeps on going down and it is going to crash again.
If you couldn't predict the drop that happened leading to 5-August, with the lower highs, the increasing bearish volume, the bearish MACD, RSI; RENKO trend breakdown, bearish moving averages cross-over and the rest, it is not your place to tells us what will happen next.
The correction will be over when prices start to go up, so far we continue seeing red and lower lows.
When it is over we will get clear signals from the chart.
You can visit my profile to find all the bullish pairs. The small Altcoins are good, the giants, not so much.
Bitcoin is in-between but it is still trading pretty high when you consider the price to be 58,000+.
58,000 is the same price at which Bitcoin traded back in February and April 2024, the baseline sits around 38,000 and 42,000; that's the minimum for this drop.
Let me go further:
It took Bitcoin 7 months of consolidation above 25,000 to be able to grow beyond 70K. That is seven months going sideways in a range between 25,000 and 32K.
That's it, that is the main, most important, most valid and most likely to be tested price range of all. This is the base created from whence Bitcoin started to grow to new highs and beyond.
When the growth is over, it goes back to test this support; will it hold? will it break?
We don't know, that is why the market moves up and down and tests those level, to see what comes next.
This price range mentioned above, matches exactly the 0.618 - 0.786 Fib. retracement range for the entire bullish wave that started back in 2022, just so you know.
We are being conservative when we say 40K.
Because Bitcoin can hit 40K in September and leave the lower range for November... Anyway, the correction is not over because Bitcoin is still down, Notcoin as well.
Namaste.

Notcoin (NOT) price may go to ALL-TIME LOW in the nearest futureNotcoin (NOT) bears have a clear objective: to push the altcoin’s price back to its all-time low of $0.005. This is reflected in the token’s struggle to break above the descending trend line it has traded below since July.
Coupled with declining network activity, the Telegram-linked token could face an additional 29% drop in price.
The analysis of Notcoin’s one-day chart reveals that the asset has been moving under a descending resistance line since July 20. This pattern indicates a bearish trend, suggesting a gradual decline in the asset’s price.
NOT’s 4% price increase over the past week suggests an effort to break above the descending resistance line. However, if this attempt fails, it will likely signal a rejection of the uptrend and a continuation of the downtrend.
The token’s declining network and whale activity further reinforce this outlook. On-chain data indicates a decrease in both daily active and new addresses trading Notcoin. Over the past week, daily active addresses for NOT dropped by 17%, while new addresses created to trade the altcoin fell by 16%.
Despite the 4% price rise over the past week, bearish bias trails Notcoin. This is reflected in its persistently negative Elder-Ray Index, which measures the bull-bear power in the market. This indicator stands at -0.00024 at press time, suggesting that bear power is dominant.
If the attempt to break above the descending trend line fails, NOT will resume its downtrend. As selling pressure mounts, it may fall toward its all-time low of $0.0048, which it last traded at on May 24.
However, if the token witnesses a shift in market sentiment from negative to positive, its price may climb toward $0.011, invalidating the bearish projections above.

NOT analysis (2H)On the hourly time frames, a diamond diametric can be seen on the NatCoin chart.
It can move from the red range to the green range and then reject upwards in the green range.
We are looking for buy/long positions in the green range.
Closing a daily candle below the invaliation level will violate the analysis.
For risk management, please don't forget stop loss and capital management
Comment if you have any questions
Thank You

NOT best level🔍 **NOT/USDT Technical Analysis - Opportunities and Challenges**
📉 **Current Trend:** The price is moving within a descending channel, indicating overall weakness in the trend. However, it seems to have reached a strong support level that could be a turning point. 📊
🔵 **Key Support Level (0.00734):**
This support level, marked with a blue zone, has historically shown price reactions. There's a high probability of a price rebound from this area, which could create a good buying opportunity if the price stabilizes here. 💪
📈 **Potential Upside Move:**
There are several key resistance levels for potential price targets:
1️⃣ **First Resistance: 0.01272** - A break above this level would indicate confirmation of an upward trend.
2️⃣ **Second Resistance: 0.01733** - A stronger resistance level that the price may reach with increased demand.
3️⃣ **Third Resistance: 0.02639** - The final target and highest level in this analysis, which could be reached if the previous resistances are broken.
⚠️ **Risk Management:**
While there’s a good opportunity to enter the trade at current levels, risk management should always be a priority. If the price fails to hold this support level and drops below it, the downtrend may continue. 📉
🚀 **Conclusion:**
This analysis suggests that the 0.00734 level is a crucial point for a price reaction, and a potential upside move could lead to the mentioned targets. The best strategy is entering at support levels and carefully managing risk. ✨


Buy Trade Idea for NOT CoinNOT Coin is positioned as a promising cryptocurrency with a strong foundation, presenting a potential buy opportunity based on key fundamentals:
Innovative Technology: NOT Coin leverages a unique blockchain architecture that enhances both speed and security. This advanced technology ensures faster transaction processing while maintaining high levels of security, making it appealing to developers and users alike.
Scalability and Efficiency: The network is designed to handle a high volume of transactions, ensuring low fees and minimal congestion. This scalability is crucial as the platform continues to grow and attract more projects.
Expanding Ecosystem: With increasing adoption and growing partnerships in the decentralized finance (DeFi) space, NOT Coin is gaining traction. The ecosystem’s expansion supports its long-term utility and demand, potentially driving its market value higher.
Strong Community Support: The project benefits from a dedicated and active community, further fostering innovation and long-term development on the platform.
These fundamentals position NOT Coin as an attractive buy opportunity for investors looking to capitalize on its growth potential and technological advantages.
Disclaimer
Cryptocurrency trading and investing carry significant risk and may lead to substantial losses. The information provided here is for educational purposes only and does not constitute financial advice. Always perform your own due diligence, assess your risk tolerance, and consult with a financial advisor before making investment decisions. Past performance is not indicative of future results, and market conditions can change rapidly.

NOT The bottom is near..BINANCE:NOTUSDT
This idea has a long-term profit target.
All targets are indicated on the graph.
- Risk 1-3% on deposit
- R/R min 1/2
P.S (This is not an investment recommendation, this is my personal opinion.)

NOTCOIN BULLISH SIGNALL!!!!!!!!NOTCOIN have bullish signal
very good situation for buy and wait too the mooon !!!!
use spot trade

NOTCOIN at Critical Support: Potential Rebound or Accumulation OHello Traders,
Here's an update on NOTCOIN.
NOTCOIN is currently at the support trendline and is likely to rebound soon. The RSI is showing a bullish divergence, indicating potential upward momentum.
On the bearish side, if NOTCOIN closes below the support trendline on the daily timeframe, it could drop toward the lower support at $0.00443, which could eventually present a good accumulation range for NOTCOIN.
Entry: $0.007 to CMP.
SL: A close below the support trendline in a daily timeframe.
Targets: $0.0125, $0.0173, $0.0238, $0.029.
Note: Accumulate the dip and have patience. Don’t trade blindly—make sure to do your own research and analysis before investing.
#NOTCOIN #cryptomarket

NOT BUYNOT/USDT Analysis: Hourly Timeframe 📊
The chart shows NOT/USDT on an hourly timeframe with Buy forecast signals. Let’s break down the upcoming opportunities based on the green lines:
🟢 September 9, 2024, 02:00 PM - Buy Date (Green Line):
This indicates a potential local bottom, offering a favorable opportunity to accumulate long positions in NOT. The price is expected to decline leading up to this point, creating good buying conditions.
🟢 September 11, 2024, 06:00 PM - Buy Date (Green Line):
Another local bottom forecasted for this date, presenting another chance to enter long positions in NOT.
🟢 September 13, 2024, 02:00 PM - Buy Date (Green Line):
A third local bottom projected for this time, offering another favorable point for long entries in NOT.
🟢 September 24, 2024, 09:00 AM - Buy Date (4h Buy):
This line marks a local low on a higher timeframe (4-hour), providing a strong opportunity for accumulation over a slightly longer horizon.
🕒 Note: All times are based on Los Angeles time (UTC -7). There may be a possible margin of error of 1-2 candles depending on the timeframe. Cross-reference this analysis with higher timeframes for more comprehensive insight into the market’s direction.

Approaching to Demand Zone | Long BiasOn Day Timeframe
BINANCE:NOTUSDT is approaching to Demand Zone
Wait Market Structure Shift to trade
My opinion likely Long position this time
Wait and see

40Days of NotWe are still in downtrend and sell posions recomended til target
also not coin will go farther and further so make sure your risk managments and Make a short Position on TOn 📉👇📉👇🔥🔥
@TradeWithMky