NOT coin analysis → after breakinghello guys.
poof! What a week!
apart from other coins, NOT coin was great and broke the descending channel.
it is forming a knife-up pattern RN! and we can expect another upward movement toward the next channel!
the blue area is assumed as target!
___________________________
✓✓✓ Always do your research.
❒❒❒ If you have any questions, you can write them in the comments below, and I will answer them.
❤︎ ❤︎ ❤︎And please don't forget to support this idea with your likes and comment
NOTUSDT_EQARK5 trade ideas


NOTHING !!BINANCE:NOTUSDT
The reasons I mentioned in the analysis before, the price increased after the wedge broke, and after the price correction wave, can reach the next targets.
✨Traders, if you liked this idea or have your opinion on it, write in the comments, We will be glad.
_ _ _ _ __ _ _ _ _ _ _ _ _ _ _ _ _ _ _ _ _ _ _ _ _ _ _ _ _ _ _ _
✅Thank you, and for more ideas, hit ❤️Like❤️ and 🌟Follow🌟!
⚠️Things can change...
The markets are always changing and even with all these signals, the market changes tend to be strong and fast!!

NOT NOT yoursthis coins is very strong and fast in recovery ,
its possible it go back down before flying up
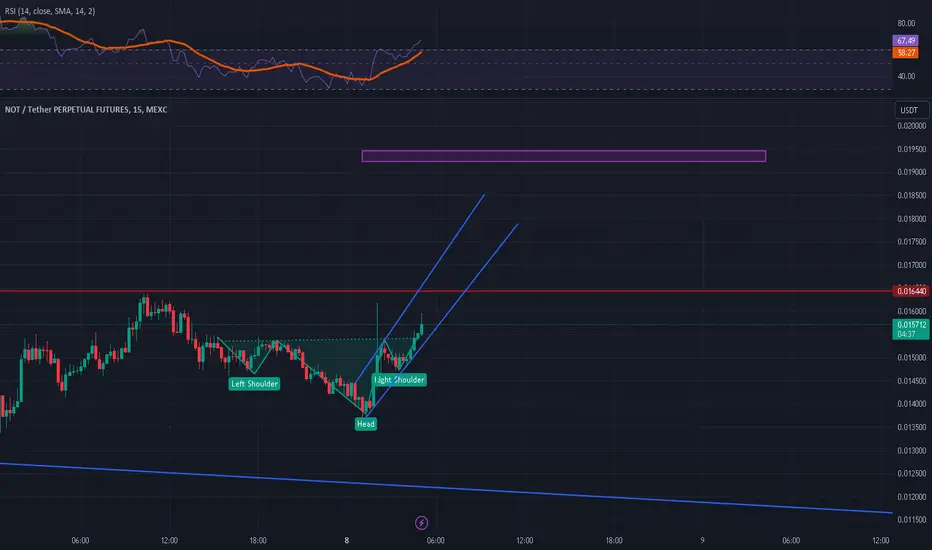
Not is at the right time to buy!Not seems like he rejected on the 0.0135 / 0.014 like I said in my last TA. Now going for a uptrend, reversed Shoulder Head Shoulder pattern expecting atleast 25% gain.
DYOR!!
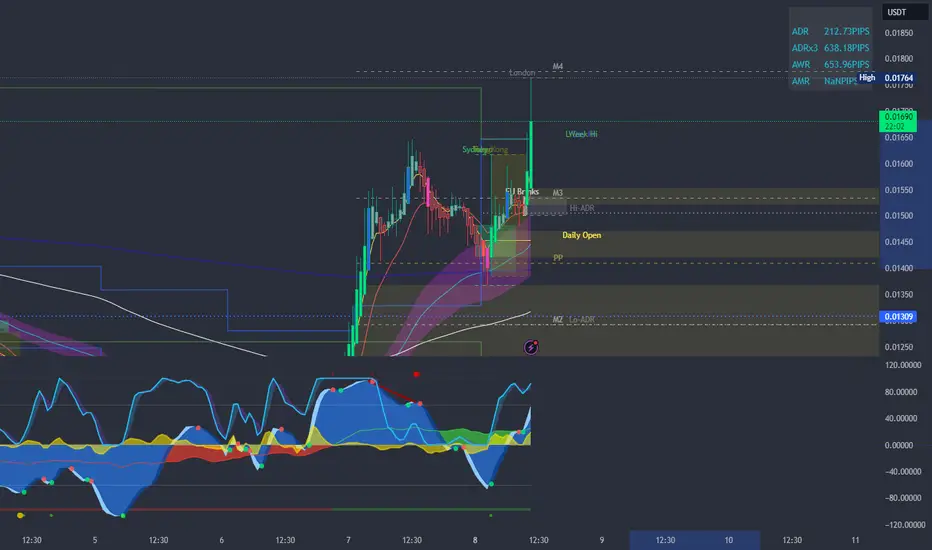
NOTUSDT - Short trade setupNOT surged to an important swing high, where we faced strong resistance. The Fibonacci speed fan perfectly acted as resistance at the swing high, showcasing a textbook low-risk trade setup for an excellent R
short trade.
Given the resistance at the swing high, it looks like we're entering a range-bound phase, building up a trading range. Expect some sideways movement as the market consolidates and prepares for the next move. Using the Fibonacci retracement tool, we identify the Fib 0.382 level as our primary short trade target. This level is crucial as it often attracts liquidity.
If you missed the initial short entry at the highs, there are still great opportunities. Consider shorting at the Point of Control (POC) or at the Fib 0.618 level of the smaller wave. The Fib 0.382 level is also an area where liquidity lies, making it perfect for taking out some long positions built up at the swing high, with a target of the Fib 0.382 level as your take profit (TP) target.
What are your thoughts on this analysis? Did you catch the initial short trade or are you eyeing the secondary entries? Share your insights and strategies below!

NotcoinMy idea about notcoin!
I think we have a sell position according to H&S pattern & then the way to the mooooon! ;)

A SELL After Test of Resistance with a candle stick pattern A sell after a test of a resistance and candle stick pattern of Engulfing

Not the right time to longNot rejected from the 0.016 and now shows a shoulder head shoulder and a descending triangle pattern. Might go back to 0.0135 / 0.014 to try again from there.

NOTUSDT - Short Trade Setup Amidst Swing High ResistanceNOT surged to an important swing high, where we faced strong resistance. The Fibonacci speed fan perfectly acted as resistance at the swing high, showcasing a textbook low-risk trade setup for an excellent R
short trade.
Given the resistance at the swing high, it looks like we're entering a range-bound phase, building up a trading range. Expect some sideways movement as the market consolidates and prepares for the next move. Using the Fibonacci retracement tool, we identify the Fib 0.382 level as our primary short trade target. This level is crucial as it often attracts liquidity.
If you missed the initial short entry at the highs, there are still great opportunities. Consider shorting at the Point of Control (POC) or at the Fib 0.618 level of the smaller wave. The Fib 0.382 level is also an area where liquidity lies, making it perfect for taking out some long positions built up at the swing high, with a target of the Fib 0.382 level as your take profit (TP) target.
What are your thoughts on this analysis? Did you catch the initial short trade or are you eyeing the secondary entries? Share your insights and strategies below!

Will the Notcoin Price Boom Continue? Don’t Miss This!OKX:NOTUSDT has shown significant movement on the 4-hour chart, indicating potential opportunities for traders.
Recently, NOT has experienced a noticeable uptick in its closing prices, moving from $0.01139 to $0.01631. This upward trend suggests growing market interest and buying pressure. Key resistance levels to watch are $0.016314, $0.018238, and $0.01923. If the Notcoin price can break through these levels, it could signal further bullish momentum.
On the downside, crucial support levels are identified at $0.01536, $0.015096, and $0.015084. These levels could provide strong buying opportunities for traders looking to enter the market on a dip. Maintaining these support levels is vital for sustaining the bullish trend.
The 9 EMA and 20 EMA are both trending upwards, with the 9 EMA leading the 20 EMA. This crossover is generally seen as a bullish signal, indicating that the short-term momentum is favoring buyers. The increasing distance between these EMAs further strengthens the bullish sentiment.
Meanwhile, the MACD indicator also supports this positive outlook. Recently, the MACD line has crossed above the signal line, and the histogram has consistently shown positive values, suggesting increasing bullish momentum. This upward crossover is a strong indicator of potential continued price appreciation.
The RSI is currently at 75, which is in the overbought territory. While this indicates strong buying interest, it also suggests that the asset might be due for a short-term correction or consolidation. Traders should be cautious of potential pullbacks and consider this when planning their entry and exit points.
Potential Trade Approaches
For traders looking to go long, an ideal entry point would be at or near the support levels of $0.01536 or $0.015096. These levels provide a good risk-reward ratio, with potential exits at the resistance levels of $0.016314, $0.018238, and $0.01923. Setting stop-loss orders slightly below the support levels can help manage risk.
For those considering short positions, entering around the resistance levels could be strategic, especially if there are signs of the price struggling to break through these barriers. Targets for short trades could be set around the support levels, with stop-loss orders placed just above the resistance to limit potential losses.
In summary, the technical analysis of NOT on the 4-hour chart indicates a predominantly bullish trend supported by moving averages, MACD, and RSI indicators. Traders should monitor the key support and resistance levels closely to make informed decisions. As always, it is crucial to exercise caution and use appropriate risk management strategies.

notcoinNotCoin has reached the supply range in a downward trend, and we expect a price correction and fall from this area

#NOT Spot Opportunity #NOT Spot Opportunity.
1●-Mark Buy
2●-Limit Buy - 0.01444
3●-Limit Buy - 0.01123
Breakout of falling wedge
Breakout of residence
Breakout of high volume
Breakout of MA

NOTUSDTHello traders ,what do you think about NOTCOIN ?
This pair has broken the trend line, it is expected to grow to the specified levels after the pullback to the broken zone.
If this post was useful to you, do not forget to like and comment❤️

NOTUSDT Idea - UpdateHey Traders!, I foresee two potential scenarios for the movement of the NOT/USDT price:
BINANCE:NOTUSDT
1. The price chart declines to the $0.01300 range, finds support, and then resumes its upward trajectory to reach $0.02100.
2. The price chart falls to the $0.01300 support area, breaks below the ascending channel, and continues to drop to $0.00750.
In my assessment, the first scenario is more likely, with an estimated 60% probability of the price rising to $0.02100.

NOT Retrace Support LevelsNice area of confluence below at the 618 golden pocket and the macro value area high and a naked daily point of control.
NAMI indicator shows money flow dropping in the negative leading to low momentum.
We just had a nice run up so a retrace would be healthy.
Not ever financial advice.


Notcoin NOT price what are you wanting to do ?)Only MM God knows how much #Notcoin can cost.
Today's idea of #NOTUSDT is purely our speculation and approximate calculations (which would take a long time to describe) and is by no means a financial recommendation.
Many people got #NOT coins for nothing, for participating in various activities, so any price of #NOTUSDT is already a profit :)
But those who trade #NOTUSDT should be much more careful, because the trading pair is quite volatile and the price movement of 50% is very easy and fast!
1️⃣ If the GETTEX:NOT price is kept above $0.019 in the near future, it will mean that they want to pump further, quickly and strongly.
Blue scenario - take profit at $0.049
2️⃣ A slightly deeper correction to $0.017 and the price holding above this level may indicate that the correction will be delayed, but the growth target may be much higher than $0.064
3️⃣ Fixing the #NOTUSDT price below $0.017, in our opinion, could open a "Pandora's box" and start a deep -45-50% correction
_____________________
Did you like our analysis? Leave a comment, like, and follow to get more

Where to buy NOTCOIN ?This analysis is an update of the analysis you see in the "Related Ideas" section.
By hitting the red range of the previous analysis, it dropped more than 64%.
From where we entered "start" on the chart, NOT correction has started.
This correction seems to be a diametric.
Our buying position is the green box. If the price reaches this range, we will look for buy/long positions.
Closing a daily candle below the invalidation level will violate the analysis.
For risk management, please don't forget stop loss and capital management
Comment if you have any questions
Thank You

NOT Dump confirmed Dear Traders ,
a lot of you dont beleive my ideas but im still sure it will dump lets see if it can play

NOT priceTraded inside a falling wedge pattern, the Notcoin price has faced profit booking and retested its vital support zone of $0.01000 this week.

Not/usdtThis area is more important for Bulish or bearish market 😉
If 0.01114 area is break , not on Bearish trend. But if trend line is break , not on bulish trend . Thats it 😉

#NOT IS FORMING FALLING WEDG PATTERN!🚨 GETTEX:NOT is forming a Falling Wedge Pattern on the 4H chart, which is typically a bullish reversal pattern.
📈 Entry Point: Start accumulating once the price exceeds $0.0140.
🎯 Targets:
Midterm Goal: 50% increase
Long Term Goal: 120% increase
🔄 Trading Options: GETTEX:NOT is available for trading in both spot and futures markets. You can purchase it on the spot market, or if you prefer to go long on futures, consider setting a stop-loss at $0.01150.
📊 About GETTEX:NOT :
NOT is a promising project in the DeFi space, aiming to revolutionize cross-chain transactions with its innovative technology. Their mission is to provide seamless and secure transactions across different blockchain networks.
📢 DYOR, NFA
#Crypto #trading
