notcoine ready to launch Chart Type and Pair: The chart is for the trading pair "NOTUSDT" on a timeframe of 4 hours (4h).
Trend Lines:
Red Channel: There is a downward-sloping red channel indicating a bearish trend.
White Trend Line: A long-term upward trend line that has been drawn from the lower left to the upper right, suggesting a strong support level.
Yellow Dashed Lines: Potential future price projections indicating possible bullish movements.
Support Zones:
Support Zone 1: Located around the price level of 0.014000, marked with green arrows.
Support Zone 2: A lower support zone around 0.012000.
Support Zone 3: Even lower around the price level of 0.008000.
Indicators:
RSI (Relative Strength Index): The RSI indicator at the bottom shows a value around 30-70, indicating the market is neither overbought nor oversold.
Annotations:
Strongest Middle Trend Line: Highlighted in the yellow box on both left and right sides of the chart, indicating significant trend lines to monitor.
Numbers 1, 2, 3: These might represent significant pivot points or patterns (like Elliott Wave, ABC correction, or another price pattern).
Patterns:
The overall pattern appears to suggest a corrective wave structure within the descending channel.
Interpretation
Current Trend: The price is in a downtrend within the red channel, indicating bearish momentum.
Support Levels: The price is nearing a support zone, which might provide some relief from the downtrend.
Potential Reversal: The yellow dashed lines indicate a potential bullish reversal. If the price can break out of the red channel, it may reach the upper targets around 0.022000 and beyond.
Conclusion
Bearish Outlook: The current price action is within a descending channel, indicating continued bearish pressure.
Potential Reversal Zones: Monitor the support zones for potential bullish reversals, especially if the price bounces off the strong middle trend line or one of the identified support zones.
Indicators: Keep an eye on the RSI for oversold conditions, which might precede a bullish reversal.
To summarize, while the current trend is bearish, there are key support zones and potential reversal patterns that could indicate a shift to bullish momentum if certain levels are breached.
If you need further analysis or updates, please let me know in the comments.
My Opinion on NOT Coin:
Based on the current technical analysis, NOT Coin is at a critical support level within a descending channel. There is potential for a bullish reversal if it breaks above the strongest middle trend line and exits the channel. However, if the support zones fail to hold, we might see further declines. Monitoring key levels and market sentiment will be essential for making informed decisions.
If you would like me to analyze another symbol, please let me know in the comments.
Wishing you happiness and wealth!
NOTUSDT_EQARK5 trade ideas

Frankly, I don't feel like explaining, the chart says it all !!Hi.
BINANCE:NOTUSDT
🔵We have a Bullish Structure here
NOTUSDT formed a falling wedge on 12h timeframe🤔
Up we go if we do breakout ,also a bullish Divergence (RD+) on MACD which shows Positive Signs for NOTCOIN.
✨Traders, if you liked this idea or have your opinion on it, write in the comments, We will be glad.
_ _ _ _ __ _ _ _ _ _ _ _ _ _ _ _ _ _ _ _ _ _ _ _ _ _ _ _ _ _ _ _
✅Thank you, and for more ideas, hit ❤️Like❤️ and 🌟Follow🌟!
⚠️Things can change...
The markets are always changing and even with all these signals, the market changes tend to be strong and fast!!

notcoinnotcoin is the best new crypto coin with perfect feature
for long time it will hits 0.69$
but
for short terms treading 0.04 is good target

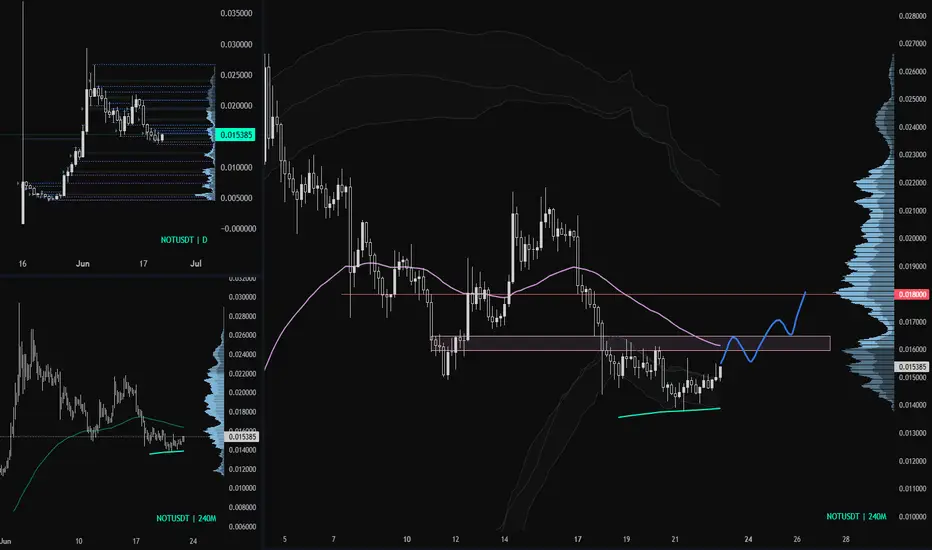
$NOT scalp long ideaIf Bitcoin continue to move in range without breaking 64k, I'm expecting NOT to retest the 4H ema50 around .016 to .0162
Let's see if we can tap our next target .0175 to .018
Placing my stop below .0135
NOT/USDTAfter updating the minimum, I expect a slight increase to the level and a retest of the bearish trend line, after which the price will move into the imbalance zone. A correction of 50-60% is normal for this product.
We will drop off buyers to get discount prices for global growth

A change in trend for NOTUSDT?EnF Breakout Strategy signaled SELL on NOTUSDT
See idea for breakout entry, targets and stoploss
Only enter the trade when the price breaks above entry
Check out more on the script:
To get access to this script, DM me

NOTCOINThe chart is similar to the Falling Wedge and the support level is an important support. According to this chart and the divergence, you should expect a short rise, but consider the market conditions.

NOTCOIN📊Analysis by AhmadArz: notcoin
In this technical analysis chart for the new token NOT/USDT, the price movement is clearly outlined. Currently, the token is priced around $0.007919 📉 and is trending upwards within the blue channel 🔵📈.
Key resistance levels are identified at $0.008822, $0.009911, and $0.011448 🔒. The analyst suggests waiting for the price to break above the $0.0114 level to anticipate another potential pump 🚀.
Additionally, a crucial support zone is marked between approximately $0.004800 and $0.005100 🛡️. If the price reaches this area, it could be considered a good buying opportunity 📈💰.
Overall, if the price can break through the mentioned resistance levels, there is potential for further increases. However, if it falls below the ascending channel and enters the lower support zone, caution is advised ⚠️.
🔗"Uncover new opportunities in the world of cryptocurrencies with AhmadArz.
💡Join us on TradingView and expand your investment knowledge with our five years of experience in financial markets."
🚀Please boost and💬 comment to share your thoughts with us!

The best opportunity to buy (notcoine ready to launch)Here's a detailed breakdown of the various elements and potential insights based on the chart:
### Key Components:
1. **Trend Lines and Channels:**
- **Red Downward Channel:** Indicates a bearish trend. The price seems to be moving within this descending channel.
- **Green and White Lines:** Suggest support levels and trend lines. These lines are important as they often act as points where the price might reverse or consolidate.
2. **Support Zones:**
- **Support Zone 1, 2, and 3:** Highlighted in green, these zones suggest areas where the price might find support and potentially bounce back.
3. **Strongest Middle Trend Line:**
- **Yellow Dotted Line:** This line is considered a strong trend line, potentially acting as a significant resistance or support level.
4. **Price Patterns:**
- **Arrows:** Blue arrows suggest potential price directions. There are both upward and downward arrows indicating possible breakout directions.
- **Dashed Yellow Lines:** These seem to project potential future price movements or breakout paths.
5. **RSI (Relative Strength Index):**
- The RSI indicator at the bottom shows the momentum of the price. Current RSI value is 75.97, indicating the asset might be overbought.
### Analysis:
1. **Current Price Action:**
- The price is currently near the lower end of the red descending channel, which is close to the support zones. This suggests a potential for a bounce back if the support holds.
2. **Potential Scenarios:**
- **Bullish Scenario:** If the price breaks above the middle trend line (yellow dotted line) and exits the red downward channel, it could target the higher resistance levels indicated by the upward arrows.
- **Bearish Scenario:** If the price fails to hold the support zones, it could continue to fall within the descending channel towards lower support levels.
3. **Key Levels to Watch:**
- **Immediate Resistance:** Around 0.016000 (as indicated by the intersection of the white and green support zone 3).
- **Immediate Support:** Around 0.014708 (current price level), followed by 0.012000 and 0.010000 within the support zones.
4. **RSI Implications:**
- With the RSI nearing the overbought territory, there could be a potential for a pullback or consolidation before any significant upward movement.
### Conclusion:
The chart indicates a critical juncture where the price is testing support zones within a bearish channel. A breakout from the descending channel and above the strongest middle trend line could signal a bullish reversal, while failure to hold support may lead to further declines. Monitoring the RSI and key support/resistance levels will be crucial for anticipating the next moves.
If you need further analysis or updates, please let me know in the comments.
My Opinion on NOT Coin:
Based on the current technical analysis, NOT Coin is at a critical support level within a descending channel. There is potential for a bullish reversal if it breaks above the strongest middle trend line and exits the channel. However, if the support zones fail to hold, we might see further declines. Monitoring key levels and market sentiment will be essential for making informed decisions.
If you would like me to analyze another symbol, please let me know in the comments.
Wishing you happiness and wealth!


Not/UsdtNo whitelist this coin technical strong if Btc reverse that point 64 k to 69 k then our target hit

Natcoin is ready to launchTo analyze the provided chart, I will take the following steps:
1. **Identify the Key Elements on the Chart**:
- Timeframe: The chart is displayed in the 4-hour (4h) interval.
- Asset: The trading pair is NOTUSDT.
- Indicators: It seems to show a potential support zone, possible trendlines, and a future price projection.
2. **Interpret the Chart**:
- **Price Movement**: The chart shows a significant price increase, followed by a gradual decline.
- **Support Zone**: The green area indicates a support zone where the price is currently hovering.
- **Trendlines**: There are dotted lines showing potential future price movements; one indicates a steep upward trend.
3. **Future Projection**:
- **Bullish Scenario**: The yellow dotted line indicates a possible bullish breakout from the current support zone, leading to a significant price increase.
- **Bearish Scenario**: The purple dotted line indicates a potential continuation of the downtrend.
4. **Technical Analysis**:
- **Support Level**: The green area represents a critical support level. If the price holds above this level, it may indicate a strong support base.
- **Resistance Levels**: Future price movements may face resistance around previously established high points.
- **Volume**: Although volume data is not visible, high trading volume at the support zone would reinforce the possibility of a bullish reversal.
### Conclusion
Based on the chart analysis:
- The asset is currently at a critical support level.
- A potential bullish scenario could see the price breaking out significantly.
- However, there is also a possibility of the price continuing its downtrend if the support fails.
### Recommendation
- **For Traders**: Monitor the support zone closely. If the price shows signs of reversing with good volume, it could be a buying opportunity. Conversely, if it breaks below the support, further decline might be expected.
- **For Long-term Investors**: Consider the overall trend and external factors affecting the asset. This support zone might be a good entry point if the long-term outlook remains positive.
Would you like a more detailed analysis on any specific aspect or additional information on technical indicators?

NOT - LongI hope the market will respect this analysis!
Please have capital and risk management!
Just Use Lev. 2 or 3!
Entry 1: 0.014
Entry 2: 0.012
TPs: 0.016 - 0.0198 - 0.024 - 0.03
SL: 0.01
JUST TRADE WITH WAVES...

#NOT1h time frame , double bottom pattern ,
Wait for break out and confirmation
Neckline at $0.01616
Short term long
#NFA #DYOR

NOTCOIN in daily time frame I think we will have a good correction to 0.012 $ then a good pump to new ATH…


Notcoin NOT moving sideways. Notcoin mitigating the red zones to moving downside. It's indicating sell side momentum.
But currently order block (1) was still valid. This order block was not fail. Next orderblock (2) was available. If this order block was fail, Notcoin moving downside.
Otherwise Notcoin moving upside. Because Notcoin still hodl order block (1).

NOTUSDT 1D#NOT is moving inside a bullish flag on the daily chart. Currently, it holds the middle line of the channel. We expect a slight upward movement from here and then a leg down to the support level of $0.012626, which is a strong support. The best buy order is around $0.012626.
Targets are:
$0.017343
$0.020189
$0.023709
$0.029400


Not Dropped, Is it going to stop?If you find this information inspiring/helpful, please consider a boost and follow! Any questions or comments, please leave a comment!
Could not break above the level identified, and it played as resistance before the drop.
With the sweep of the low, it could lead to lower lows.
I am keeping an eye on these levels, here and below the current PA, for support.
If it heads down to them, I will be watching for a reaction off of the levels in conjunction with other confluences.
If its going to turn up from here, the same levels could be key.
I would want to see a break above and a flip to support.
Trade Safe!
Trade Clarity!

NOTWe expect that after forming a Double Bottom pattern, the currency will start to show positivity and enter an upward trend.

Best Areas For MAX Profit!The two areas shown on the chart are the best areas to consider taking a long to maximize profits!
Calculate Your Risk/Reward so you don't lose more than 1% of your account per trade.
Every day the charts provide new information. You have to adjust or get REKT.
Love it or hate it, hit that thumbs up and share your thoughts below!
This is not financial advice. This is for educational purposes only.
