notcoin as we can see notcoin once has trid to break up the downtrend line with the trend candle 27sep 2024. but after it could not to hold the new area and again it fell down to test the static support area . with candles 4 and 6 oct 2024 support was done but again when it reached to the dynamic down trend line it has been weakened . in my opinion the stock should break up the hh of the candle 27 sep 2024 to start a uptrend.
NOTUST trade ideas

NOTHING !!NOTCOIN is forming a falling wedge on Daily timeframe , Up we go if we do breakout. the price can be bullish and I expect the price to go up to the Fibonacci line of 0.618 = 0.0012 Stay tuned for more updates, thanks.
✨We spend hours finding potential opportunities and writing useful ideas, we would be happy if you support us.
Best regards CobraVanguard .💚
_ _ _ _ __ _ _ _ _ _ _ _ _ _ _ _ _ _ _ _ _ _ _ _ _ _ _ _ _ _ _ _
✅Thank you, and for more ideas, hit ❤️Like❤️ and 🌟Follow🌟!
⚠️Things can change...
The markets are always changing and even with all these signals, the market changes tend to be strong and fast!!

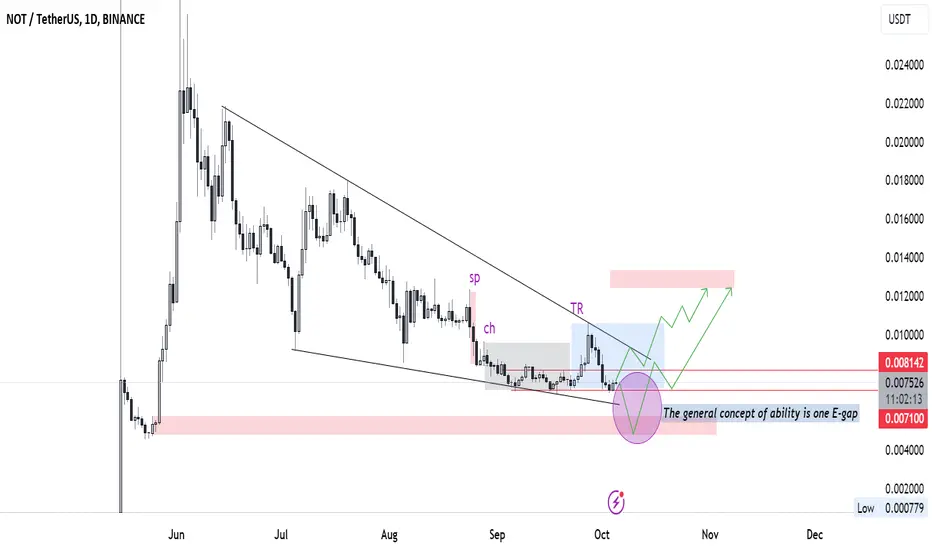
Notcoin: Round 2 (Short-Term Higher Low)Notcoin is ready to go again... Just recently we spotted a low on this chart and this low preceded a minor bullish move. This bullish move was corrected and ended as a higher low on the 3rd of October. We have the main low in September and higher low in October; Notcoin (NOTUSDT) is ready to go again.
➖ Current price action is bullish. We see the higher low coupled with rising volume and a move above three exponential moving averages, EMA8, 13 and 21. A higher low can lead to a higher high.
The targets can be seen on the chart.
Remember how fast it moved last time, it went green for five days straight. We can see something similar but with bigger candles and stronger growth.
Thank you for reading.
Prepare for action.
Thanks a lot for your continued support.
Namaste.

Notcoin NOT price is preparing for x9 growth?OKX:NOTUSDT price is trying to gain a foothold in the upper half of the falling correction channel that has been stretching since the beginning of summer.
👉 Risky purchase of #NOT closer to $0.007
👉 A safer purchase after the #NOTUSDC price breaks out of the channel and is firmly established above $0.009
Do you want #Notcoin at $0.075 and preferably by the end of 2024 ?)
_____________________
Did you like our analysis? Leave a comment, like, and follow to get more

NOTCOIN (NOTUSDT) Elliott Wavehello friends
In NOTCOIN (NOTUSDT) digital currency, we see the formation of a 5-wave or ziggurag pattern. Waves 1 or A, 2 or B, and 3 or C have been completed.
According to the above, two possible scenarios can be considered.
In the first scenario, we consider the formation of 5 impulse waves.
Assuming 5 waves and considering the formation of waves 1-4, we will expect the formation of wave 5 and the range of 0.0086 can be its first target. The stop loss of this scenario can be considered as 0.007717. Of course, as long as the closing price of wave 4 does not interfere with the closing price of wave 1, the theory is still valid and stop-plus can be cautiously considered on the closing price of wave 1.
The second scenario is to consider a zigzag.
This theory consists of 3 waves, which will be valid if the specified price floor is broken.
To support me, I recommend you install Trading View software on your phone and see my analysis and support me with your comments and Boost. Be successful and profitable.

#NOT/USDT#NOT
The price is moving in an ascending channel on the 1-hour frame and is sticking to it greatly and is about to break upwards
Some decline is expected to touch the lower limit of the channel
We have a bounce from the lower limit of the channel at a price of 0.007000
We have an upward trend on the RSI indicator about to break, which supports the rise
We have a trend to stabilize above the moving average 100
Entry price 0.007459
First target 0.007980
Second target 0.008738
Third target 0.009700

NOTCOIN BULLISH IDEAHi traders,
It's been a long while since I shared my trade objectives here.
NOT/USDT looks bullish as it just broke out from a 4H descending wedge and retested the resistance line as a newly formed support.
Trade parameters are seen on the chart.
Let's make some money together.

NOT/USDT BREAKOUT ALERT: READY FOR TAKEOFF!!Hey everyone!
If you're enjoying this analysis, please give it a thumbs up and follow!
NOT is showing potential here. It’s breaking out from a falling wedge-like structure on the daily time frame and is currently hovering near the wedge. This could be a good buying opportunity, with a chance to add more on dips.
Entry range: Current Market Price (CMP) and accumulate up to $0.0068
Targets: $0.0104 / $0.0136 / $0.0172 / $0.0225
Stop Loss (SL): $0.0054
What are your thoughts on NOT's current price action? Do you see a bullish setup? Share your analysis in the comments below!

Notcoin buyThe general trend is downward, and only one unsuccessful attempt to return the price has been made, and we still have short-term downward expectations, but it is in a good place to monitor it.
NOTUSDT: Break out of parallel channel!Join our community and start your crypto journey today for:
In-depth market analysis
Accurate trade setups
Early access to trending altcoins
Life-changing profit potential
NOTUSDT has broken out of a parallel channel. The price is being supported by the 50-day moving average, and the RSI is currently at a support trend line.
Entry Zone:
CMP to $0.007417
SL: $0.006978
Targets level:
$0.007906
$0.008868
$0.009767
$0.010549
If you find this analysis helpful, please hit the like button to support my content! Share your thoughts in the comments and feel free to request any specific chart analysis you’d like to see.
Happy Trading!!


NOTUSDT: Broke out of bullish pennant!!Join our community and start your crypto journey today for:
In-depth market analysis
Accurate trade setups
Early access to trending altcoins
Life-changing profit potential
Let's analyse NOTUSDT both fundamentally and technically.
FUNDAMENTAL ANALYSIS:
Notcoin started as a viral Telegram game that onboarded many users into web3 through a tap-to-earn mining mechanic.
GETTEX:NOT is a community token :
Explore: users earn when discover web3 products
Play: users participate in new games and get more
Contribute: users earn by adding value to the ecosystem
Offer: web3 builders can offer their products to the community via Notcoin campaigns
TECHNICAL ANALYSIS:
NOTUSDT has broken out of a bullish pennant, and the retest appears to be complete. The price is currently at a key support zone, and I’m anticipating a bounce from this level. Additionally, the RSI is also showing a bounce from its current position.
Entry Zone:
$0.006834 to $0.007548
Resistance Levels:
$0.012391
$0.017407
$0.023129
If you find this analysis helpful, please hit the like button to support my content! Share your thoughts in the comments and feel free to request any specific chart analysis you’d like to see.
Happy Trading!!

NOT Ready to Pump? Strong Support and Fibonacci Point to 0.017 TNOT/USDT: Poised for a Breakout? Fibonacci and Strong Support Converge
NOT/USDT appears to be gearing up for a potential price surge, as it's currently trading within a strong support zone and showing signs of a possible breakout from a descending triangle pattern. This confluence of technical factors suggests a bullish scenario may be unfolding.
Here's a breakdown:
Strong Support: The chart clearly shows NOT bouncing off a significant support zone (highlighted in your image). This area has historically acted as a floor for the price, indicating strong buying interest at these levels.
Descending Triangle: The price action has formed a descending triangle pattern, characterized by a descending upper trendline and a horizontal lower support line. This pattern often precedes a breakout, and in this case, the anticipation is for an upward move.
Fibonacci Confluence: You've identified a key Fibonacci retracement level (3.618) that aligns with the upper trendline of the triangle and your projected target of 0.017. This adds further weight to the potential for a breakout to this level.
Why This Matters
The combination of these factors creates a compelling case for a potential bullish move. The strong support suggests buyers are defending this zone, while the descending triangle hints at a build-up of buying pressure that could lead to a breakout. The Fibonacci confluence further strengthens this argument by providing a potential target for the upward move.
What to Watch For
Breakout Confirmation: A decisive break above the upper trendline of the triangle with increased volume would confirm the bullish scenario.
Volume: Rising volume on upward price movements would further support the breakout.
Resistance Levels: Keep an eye on potential resistance levels above the current price, which could temporarily halt the upward momentum.
Disclaimer: This is not financial advice. Trading involves significant risk, and you should always conduct your own research and consult with a qualified financial professional before making any investment decisions.

NOT Coin 1 Hour AnalysisAs we saw market crashed and GETTEX:NOT took quite a hit we have a strong support here if things go well for BTC we can see a good bounce in GETTEX:NOT but as here you can have a small trade of buying altho will be risky you can open a buy position and put you SL below the Support
NFA DYOR
HAPPY TRADING
If you need analysis of a specific coin lemme know Thanks

NOTUSDTNOT ~ 1D ✅
#NOT If you have Conviction on this coin,. You need to consider purchasing on this support block.

Not wont Lose this area never Hi dears .
How you doin ? G ?!
Not cant lose this strong support zone that appears from more than 10m Dollar liqudity
so dont worry and make a buy postion in Not and less than a year you will see what I said
there is one of my articles
Dont lose this oppurtiny
NOT LONG 🤑✅📈✅🤑📈✅🤑🔥🔥🔥🚀🚀🚀 @TradeWithMky


Is #NOTUSDT About to Explode or Plunge? Key Levels to WatchYello Paradisers! Are you ready for what could be a game-changing move in #NOTUSDT? Let's look at the latest analysis of the #NOT and see what's happening:
💎Currently, #Notcoin is tightly coiled within a falling wedge, a classic pattern that often signals a massive bullish breakout. Let's see what could be the next probable moves for the asset.
💎If the bulls gather enough strength, we could soon see a breakout from this formation that could ignite a powerful upward wave. Our first target? The bearish order block (OB) at $0.012. If momentum holds, we could even see a push toward the major resistance level beyond that.
💎But let's not get ahead of ourselves. Caution is crucial. Should the bulls fail to muster the necessary force, we could be looking at a slide toward the lower support zone between $0.0057 and $0.0071 as it hunts for liquidity.
💎And remember, if the major support zone doesn't hold, then the selling pressure will only increase, potentially driving GETTEX:NOT further down.
Stay focused, patient, and disciplined, Paradisers🥂
MyCryptoParadise
iFeel the success🌴

NOT game planI will be waiting to see accumulation to happen.
first i want to see new local low, then breakout of supply zone and retest it for entry.
Will update later keep following

Trade Idea for $NOT COIN (Hourly Time Frame)Not is a crucial point it is the same point it broke up from last time as encircled in the chart so we need to keep an eye if the BTC pumps GETTEX:NOT can follow and break is Hourly Down Trend line Or if BTC Dumps We can see a movement downwards there are few chances we are gonna break the Support. BULLISH ON GETTEX:NOT in future

NOTHING !!NOTCOIN is forming a falling wedge on Daily timeframe , Up we go if we do breakout. the price can be bullish and I expect the price to go up to the Fibonacci line of 0.618 = 0.0013 Stay tuned for more updates, thanks.
✨Traders, if you liked this idea or have your opinion on it, write in the comments, We will be glad.
_ _ _ _ __ _ _ _ _ _ _ _ _ _ _ _ _ _ _ _ _ _ _ _ _ _ _ _ _ _ _ _
✅Thank you, and for more ideas, hit ❤️Like❤️ and 🌟Follow🌟!
⚠️Things can change...
The markets are always changing and even with all these signals, the market changes tend to be strong and fast!!

Notcoin - Time to buy again!Notcoin is forming a falling wedge on Daily timeframe , Up we go if we do breakout.
✨Traders, if you liked this idea or have your opinion on it, write in the comments, We will be glad.
_ _ _ _ __ _ _ _ _ _ _ _ _ _ _ _ _ _ _ _ _ _ _ _ _ _ _ _ _ _ _ _
✅Thank you, and for more ideas, hit ❤️Like❤️ and 🌟Follow🌟!
⚠️Things can change...
The markets are always changing and even with all these signals, the market changes tend to be strong and fast!!

NOTUSDT has formed a Pretty Big falling wedge Pattern!...Notcoin is forming a falling wedge on Daily timeframe , Up we go if we do breakout.
✨Traders, if you liked this idea or have your opinion on it, write in the comments, We will be glad.
_ _ _ _ __ _ _ _ _ _ _ _ _ _ _ _ _ _ _ _ _ _ _ _ _ _ _ _ _ _ _ _
✅Thank you, and for more ideas, hit ❤️Like❤️ and 🌟Follow🌟!
⚠️Things can change...
The markets are always changing and even with all these signals, the market changes tend to be strong and fast!!
