NOT best level🔍 **NOT/USDT Technical Analysis - Opportunities and Challenges**
📉 **Current Trend:** The price is moving within a descending channel, indicating overall weakness in the trend. However, it seems to have reached a strong support level that could be a turning point. 📊
🔵 **Key Support Level (0.00734):**
This support level, marked with a blue zone, has historically shown price reactions. There's a high probability of a price rebound from this area, which could create a good buying opportunity if the price stabilizes here. 💪
📈 **Potential Upside Move:**
There are several key resistance levels for potential price targets:
1️⃣ **First Resistance: 0.01272** - A break above this level would indicate confirmation of an upward trend.
2️⃣ **Second Resistance: 0.01733** - A stronger resistance level that the price may reach with increased demand.
3️⃣ **Third Resistance: 0.02639** - The final target and highest level in this analysis, which could be reached if the previous resistances are broken.
⚠️ **Risk Management:**
While there’s a good opportunity to enter the trade at current levels, risk management should always be a priority. If the price fails to hold this support level and drops below it, the downtrend may continue. 📉
🚀 **Conclusion:**
This analysis suggests that the 0.00734 level is a crucial point for a price reaction, and a potential upside move could lead to the mentioned targets. The best strategy is entering at support levels and carefully managing risk. ✨
NOTUST trade ideas


Buy Trade Idea for NOT CoinNOT Coin is positioned as a promising cryptocurrency with a strong foundation, presenting a potential buy opportunity based on key fundamentals:
Innovative Technology: NOT Coin leverages a unique blockchain architecture that enhances both speed and security. This advanced technology ensures faster transaction processing while maintaining high levels of security, making it appealing to developers and users alike.
Scalability and Efficiency: The network is designed to handle a high volume of transactions, ensuring low fees and minimal congestion. This scalability is crucial as the platform continues to grow and attract more projects.
Expanding Ecosystem: With increasing adoption and growing partnerships in the decentralized finance (DeFi) space, NOT Coin is gaining traction. The ecosystem’s expansion supports its long-term utility and demand, potentially driving its market value higher.
Strong Community Support: The project benefits from a dedicated and active community, further fostering innovation and long-term development on the platform.
These fundamentals position NOT Coin as an attractive buy opportunity for investors looking to capitalize on its growth potential and technological advantages.
Disclaimer
Cryptocurrency trading and investing carry significant risk and may lead to substantial losses. The information provided here is for educational purposes only and does not constitute financial advice. Always perform your own due diligence, assess your risk tolerance, and consult with a financial advisor before making investment decisions. Past performance is not indicative of future results, and market conditions can change rapidly.

NOT The bottom is near..BINANCE:NOTUSDT
This idea has a long-term profit target.
All targets are indicated on the graph.
- Risk 1-3% on deposit
- R/R min 1/2
P.S (This is not an investment recommendation, this is my personal opinion.)

NOTCOIN BULLISH SIGNALL!!!!!!!!NOTCOIN have bullish signal
very good situation for buy and wait too the mooon !!!!
use spot trade

NOTCOIN at Critical Support: Potential Rebound or Accumulation OHello Traders,
Here's an update on NOTCOIN.
NOTCOIN is currently at the support trendline and is likely to rebound soon. The RSI is showing a bullish divergence, indicating potential upward momentum.
On the bearish side, if NOTCOIN closes below the support trendline on the daily timeframe, it could drop toward the lower support at $0.00443, which could eventually present a good accumulation range for NOTCOIN.
Entry: $0.007 to CMP.
SL: A close below the support trendline in a daily timeframe.
Targets: $0.0125, $0.0173, $0.0238, $0.029.
Note: Accumulate the dip and have patience. Don’t trade blindly—make sure to do your own research and analysis before investing.
#NOTCOIN #cryptomarket

NOT BUYNOT/USDT Analysis: Hourly Timeframe 📊
The chart shows NOT/USDT on an hourly timeframe with Buy forecast signals. Let’s break down the upcoming opportunities based on the green lines:
🟢 September 9, 2024, 02:00 PM - Buy Date (Green Line):
This indicates a potential local bottom, offering a favorable opportunity to accumulate long positions in NOT. The price is expected to decline leading up to this point, creating good buying conditions.
🟢 September 11, 2024, 06:00 PM - Buy Date (Green Line):
Another local bottom forecasted for this date, presenting another chance to enter long positions in NOT.
🟢 September 13, 2024, 02:00 PM - Buy Date (Green Line):
A third local bottom projected for this time, offering another favorable point for long entries in NOT.
🟢 September 24, 2024, 09:00 AM - Buy Date (4h Buy):
This line marks a local low on a higher timeframe (4-hour), providing a strong opportunity for accumulation over a slightly longer horizon.
🕒 Note: All times are based on Los Angeles time (UTC -7). There may be a possible margin of error of 1-2 candles depending on the timeframe. Cross-reference this analysis with higher timeframes for more comprehensive insight into the market’s direction.

Approaching to Demand Zone | Long BiasOn Day Timeframe
BINANCE:NOTUSDT is approaching to Demand Zone
Wait Market Structure Shift to trade
My opinion likely Long position this time
Wait and see

40Days of NotWe are still in downtrend and sell posions recomended til target
also not coin will go farther and further so make sure your risk managments and Make a short Position on TOn 📉👇📉👇🔥🔥
@TradeWithMky
NOT/USDT: POTENTIAL FALLING WEDGE PATTERN! ACCUMULATE HERE!!Hey everyone!
If you're enjoying this analysis, a thumbs up and follow would be greatly appreciated!
NOT/USDT looks good here. It is forming a falling wedge-like structure in the daily time frame and currently hovering near the lower trendline of the wedge. It is a good area to accumulate some on the spot or with low leverage.
Entry range:- $0.0070-$0.0076
Target:- 150-200%
SL:- $0.006(For leverage)
What are your thoughts on NOT's current price action? Do you see a bullish pattern? Share your analysis in the comments below!

Notcoin (NOT) price stabilises. What's next?Following in TON's footsteps, the NOT crypto has displayed a similar price action by adding approximately 4% to its valuation within the past day. With strong fundamentals and a discounted price of 73.4%, this crypto project holds a high long-term bullish return.
The Relative Strength Index (RSI) indicator has successfully retested its oversold range in the 1D time frame. This suggests an increase in the price of altcoin in the crypto market. Notably, with the rising volatility, a bullish rebound is anticipated from the Ton-chain in the coming time.
Maintaining the price above its resistance level of $0.00925 could set the stage for NOT coin price to test its upper level of $0.0140. However, if the bearish sentiment intensifies, this altcoin could retest its low of $0.00455 this month.

Notcoin By HesamUNTHey traders
As u can see, not still playing in the 4H falling wedge
The lower trendline which is below the 0.236 fib can b a gr8 entry
Breaking out the pattern will b one of the confirmations
Also ichi still playing bearish, breaking up the SenkouA in daily n 4H TF will b the second confirmation
What u think about notcoin?
Share ur chart n leave a comment

NOT ANALYSIS (pump & dump)🔮 #NOT Analysis Pump & Dump
🌟🚀 There is a complete formation of Falling Wedge Pattern in #NOT. As we can see that there is a breakdown of the pattern in 12hr time frame. We can see a dump first in #NOT and then a reversal from its support zone.🚀🚀
🔖 Current Price: $0.00745
⁉️ What to do?
- We have marked some crucial levels in the chart. We can trade according to the chart and make some profits in #NOT. 🚀💸
#NOT #Cryptocurrency #DYOR

NOTUSDT 4H possible LONG setup - Sep 04 2024#NOT Looks very promising indeed but there's the possible risk regarding Durov's case in France so one needs to mind the risk regarding opening a position
Entry zone: 0.0073 - 0.0078
TPs:
0.00829 - 0.00897 - 0.00953 - 0.01010
Stoploss: 0.00725

NOTUSDT Price Prediction (Update)Trend Prediction - BTC/USDT Forecasting -
Resistance and Support Lines Falling Wedge Pattern
**** Yousef Sharafi ****
Follow me here for more analysis

NOT BUY🔍 NOT/USDT Analysis: 1-Hour Timeframe 📉
The NOT/USDT chart on a 1-hour timeframe highlights significant upcoming times where price movements may present trading opportunities. It’s essential to analyze these signals in conjunction with higher timeframes for a comprehensive market view.
• BUY DATE - September 3, 2024, 15:00 - Green Line: This time indicates a potential local low, offering favorable conditions for accumulating NOT or entering long positions.
• BUY DATE - September 5, 2024, 13:00 - Green Line: Another potential local low, suggesting another opportunity to accumulate NOT or enter new positions.
• BUY DATE - September 7, 2024, 15:00 - Green Line: Additional potential local low, where considering entry into positions could be beneficial.
• BUY DATE - September 9, 2024, 22:00 - Green Line: A final potential local low within this timeframe, marking a favorable condition for entering long positions.
When working with this 1-hour timeframe, remember to evaluate these movements within the context of the broader market trend, considering higher timeframes for a more global perspective.

$NOT Breakout Incoming!🚨 GETTEX:NOT is nearing the apex of a Descending Triangle pattern on the 12H chart, a setup that could indicate a potential breakout.
📈 Entry Point: $0.0080 to $0.0085
🎯 Targets: $0.0120 $0.0160 $0.0200 $0.0240
🔄 Trading Options: GETTEX:NOT is available for trading in both spot and futures markets. You can consider entering a position on the spot market or going long in futures. A stop-loss at $0.0075 is recommended to manage risk.
📊 About GETTEX:NOT :
NOT is currently consolidating within a well-defined range. A breakout above the upper trendline could trigger a significant move, with the potential to reach the mentioned target levels.
📢 DYOR, NFA #Crypto #Trading #CryptoAnalysis

Natcoin Analysis and Buying Scenarios
As seen on the chart, Natcoin is currently moving within a wedge pattern, indicating price compression and the possibility of a significant upcoming move 📉📈.
Scenario 1**: If the price breaks downwards, it could lead to a parabolic movement towards the **0.00576** level (Level 1). This area could be seen as a **buying opportunity** 🛒.
Scenario 2**: If the price moves within the wedge and then breaks upwards, we could see an early entry point in the daily time frame before a trend reversal occurs. This scenario would allow traders to capitalize on the upward movement 📈.
The divergence between the formed lows and the wedge pattern can help us identify a **better entry price** before a potential trend reversal 🔄.
- Trend Analysis
- Support and Resistance
- Chart Patterns
#Natcoin #Cryptocurrency #WedgePattern #TrendReversal #Tradecitypro #TCP #TradingOpportunities

Not#Not
#notusdt
Not is framing double bottom pattern in 4h time frame .
Wait till the break out and confirmation.
The target is -$0.0091
Put the sl as per your strategy 🚨
#dyor
#nfa

NOT Very bullish Just my thoughts
If pavel release before notcoin reach 0.007 then it's gonna boom to the moon

NOTCOIN (NOTUSDT): More Collapse is Coming?!I spotted a strong bearish pattern on NOTCOIN when looking at the daily chart.
The coin has formed a descending triangle pattern and has broken through its horizontal neckline.
The broken neckline and trend line now make up a contracting supply zone.
This could signal the start of a bearish movement. The target price is 0.00649.

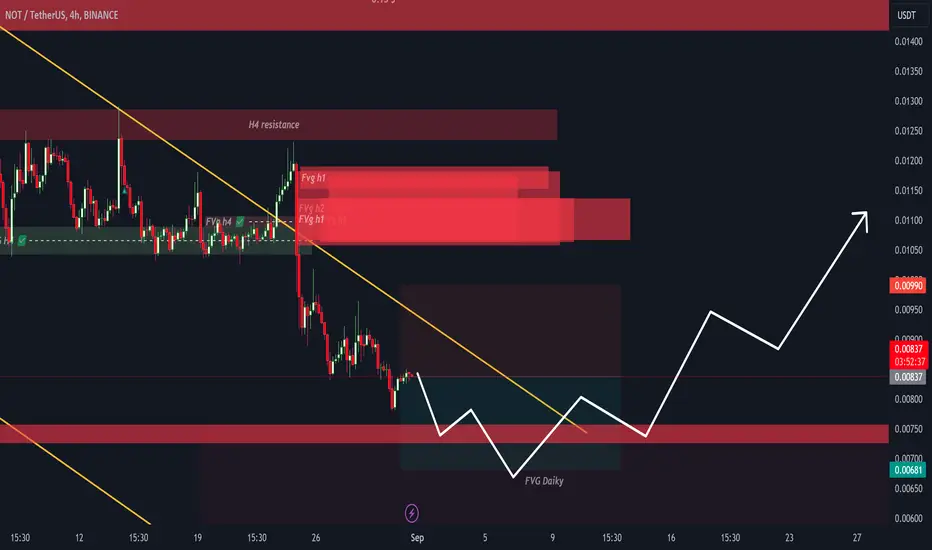
Potential for upward movementNOT is in a downtrend and has reached the $0.0075 support level. This level is recognized as a strong support that could prevent further price declines and increase the likelihood of a price rebound towards higher levels.
One possible scenario is that the price finds support at the $0.0075 area and, after observing bullish confirmations, moves towards higher levels such as $0.010 and $0.012. This movement could indicate the end of the current downtrend and the beginning of a new upward trend.
If the price fails to hold the $0.0075 level and breaks it, the downtrend may continue, pushing the price to lower levels. This scenario would indicate increased selling pressure in the market.

NOTUSDTMoney works wonders and Pavel Durov was released on bail with a ban on leaving France. This creates the possibility of a rebound to 0.1 usd. The main factor will be the judgment, so this long is very speculative. Good luck traders.
