NOT/USDT Technical Analysis in 12-Hour TimeframeHello everyone, I’m Cryptorphic.
For the past seven years, I’ve been sharing insightful charts and analysis.
Follow me for:
~ Unbiased analyses on trending altcoins.
~ Identifying altcoins with 10x-50x potential.
~ Futures trade setups.
~ Daily updates on Bitcoin and Ethereum.
~ High time frame (HTF) market bottom and top calls.
~ Short-term market movements.
~ Charts supported by critical fundamentals.
Now, let’s dive into this chart analysis:
NOT is under a symmetrical triangle pattern, facing resistance at the 21 EMA at $0.01160. If the price gets rejected from this resistance, it is likely to reach the green box between $0.00988 and $0.01056.
The crucial resistance for NOT is at $0.013, and once it breaks above this resistance trendline, a bullish rally is possible. The support trendline between $0.00988 and $0.01056 must hold the price.
Key levels:
- Support/Accumulation: $0.00988-$0.01056
- Resistance: $0.01160 (EMA) and $0.013 (Resistance trendline)
- Target: $0.03
We will re-analyze the chart if the price closes below the support trendline.
DYOR, NFA.
Please hit the like button to support my content and share your thoughts in the comment section. Feel free to request any chart analysis you’d like to see!
Thank you!
#PEACE
NOTUST trade ideas

Notcoin(NOT) Analysis==>>TriangleNotcoin(NOT) is moving in the Heavy Resistance zone($0.0158_$0.0153) and broke the symmetric triangle's upper line and 100_SMA(4-hour TF) ( with significant volume ).
According to the theory of Elliott waves , it seems that we should wait for the next 5 impulse waves of Notcoin(NOT) .
I expect Notcoin(NOT) to rise again, at least until the Monthly Pivot Point . If the Heavy Resistance zone($0.0158_$0.0153) is broken, we can wait for the Notcoin(NOT) pump .
Notcoin(NOT) Analyze (NOTUSDT), 1-hour time frame ⏰.
Do not forget to put Stop loss for your positions (For every position you want to open).
Please follow your strategy; this is just my Idea, and I will gladly see your ideas in this post.
Please do not forget the ✅' like '✅ button 🙏😊 & Share it with your friends; thanks, and Trade safe.

Not is exactly where we want #NotCoinThanks alot for your supports ♥
if you were agree Boast it to moon 🚀
Notcoin just has recently broken DownTrend 📉❌
Now we are waiting for a bullish UP Trend 📈🔝🆙
Hold some Notcoin in Notcoin app and after release you would be More happy 😍

NOT BREAKOUT BEARISH TREND LINE Hi dear traders
The price breakout and retest bearish trend line, and now ready to attack to resistance area near 0.014.
If hold 0.012 in daily time frame we expect to reach all targets
Let's see what happens
This is not financial advice ( DYOR )
Good luck 👍


NOTCOIN: DOWN BEFORE A POSSIBLE $0.01160I think it would be best to wait a bit for NOTCOIN to sell in the $0.01091 zone before buying up.
remember that fundamental may change things. always use SL

Notcoin(NOT) Roadmap!!!Notcoin(NOT) is moving in the Heavy Resistance zone($0.0158_$0.0153) and seems to have broken the Support lines .
According to Elliott's wave theory , Notcoin(NOT) is completing the Zigzag Correction .
I expect Notcoin(NOT) to drop to at least $0.01093 and touch the Potential Reversal Zone(PRZ) next.
Notcoin(NOT) Analyze (NOTUSDT), 1-hour time frame ⏰.
Do not forget to put Stop loss for your positions (For every position you want to open).
Please follow your strategy; this is just my Idea, and I will gladly see your ideas in this post.
Please do not forget the ✅' like '✅ button 🙏😊 & Share it with your friends; thanks, and Trade safe.

Can NOTCOIN Reach $0.01545? I am BullishA Midterm Bullish Analysis
Current Price: $0.01217
Target Price: $0.01545
Midterm Perspective: Bullish
As of the current price of $0.01217, NOTCOIN is in a consolidation phase after experiencing significant volatility. The broader cryptocurrency market has shown signs of recovery after a bearish period, with several altcoins gaining traction.
The market sentiment appears cautiously optimistic, especially for meme coins like NOTCOIN, which have strong community support.
Conclusion
NOTCOIN has the potential to reach $0.01545 from its current price of $0.01217, given favourable market conditions

CAN PEPE GET TO $0.01545? I AM BULLISH MIDTERMCan Pepe (PEPE) Reach $0.01545 from Its Current Price of $0.01217? A Midterm Bullish Analysis
Current Price: $0.01217
Target Price: $0.01545
Midterm Perspective: Bullish
As of the current price of $0.01217, Pepe is in a consolidation phase after experiencing significant volatility. The broader cryptocurrency market has shown signs of recovery after a bearish period, with several altcoins gaining traction.
The market sentiment appears cautiously optimistic, especially for meme coins like PEPE, which have strong community support.

NOTUSDT SHORT IDEAHi My Friends. I see Wyckoff in 4h timefream.
entry:0.01322
tp:0.01103
sl:0.01411
you can use 5X or 3X leverage.

10th Aug 2024 - NOT USDT LONG - EW, Fib, 50 EMANOT USDT should go long from the mentioned retracement point.

(Update) !!! Daily Chart Analysis : Bull or Bear ? (READ)BINANCE:NOTUSDT
The reasons I mentioned in the analysis before, the price increased after the wedge broke, and after the price correction wave, can reach the next targets.
Previous Analysis
✨Traders, if you liked this idea or have your opinion on it, write in the comments, We will be glad.
_ _ _ _ __ _ _ _ _ _ _ _ _ _ _ _ _ _ _ _ _ _ _ _ _ _ _ _ _ _ _ _
✅Thank you, and for more ideas, hit ❤️Like❤️ and 🌟Follow🌟!
⚠️Things can change...
The markets are always changing and even with all these signals, the market changes tend to be strong and fast!!

Is NOTUSDT About to Break Out? Watch This Key Zone Closely!Yello, Paradisers! Could we be on the verge of a bullish breakout with NOTUSDT? 📈
💎NOTUSDT has recently formed a classic falling wedge pattern, and we're also seeing a potential W pattern near the resistance zone. These formations are often precursors to a bullish move, but we need a confirmed candle close above the resistance zone to solidify this outlook.
💎If we do see a breakout, the bullish momentum could carry us higher. However, if NOTUSDT pulls back instead, a bounce from the support zone is likely. That said, given the current bearish sentiment across the broader crypto market, it’s wise to approach with caution. Scalping with smaller targets (TGs) might be the best strategy here to protect your capital.
💎Keep in mind, though, that a breakdown and candle close below the support zone will invalidate our bullish idea, signaling a potential continuation of the bearish trend.
If you want to be consistently profitable, you need to be extremely patient and always wait only for the best, highest probability trading opportunities.
MyCryptoParadise
iFeel the success🌴

Bearish Momentum Points to $0.01060 TargetOverview:
Notcoin (NOT) is showing signs of weakening after encountering resistance at the $0.01230 mark. The current market structure suggests a potential decline, with bearish indicators pointing towards a drop to the $0.01060 region. The formation of a bearish Luftwing candle structure on the 4-hour chart supports this outlook.
Key Levels to Watch:
Resistance: $0.01230
Support: $0.01159
Target: $0.01060
Price Action:
Notcoin has faced resistance at $0.01230, a level that has been tested multiple times without success. This resistance has now become a significant barrier, as the bulls have struggled to push the price higher. As a result, the price has started to retrace, and the support at $0.01100 is currently under pressure. A break below this support could open the door for further declines.
Technical Indicators:
Bearish Luftwing Candle Structure: On the 4-hour chart, a bearish Luftwing candle structure has emerged. This pattern is a strong signal of a potential downtrend continuation, indicating that the current bearish momentum could push Notcoin towards the $0.01060 target.
Volume Analysis: There has been a noticeable increase in selling volume around the $0.01230 resistance level, further indicating that the bears are in control. This increase in volume is a key confirmation of the bearish sentiment.
RSI: The Relative Strength Index (RSI) on the 4-hour chart is trending downwards after reaching overbought levels. This suggests that the momentum is shifting in favor of the bears, increasing the likelihood of further downside.
Market Sentiment:
The market sentiment for Notcoin is turning increasingly bearish. The repeated failure to break above the $0.01230 resistance and the formation of bearish patterns on the chart indicate that sellers are gaining strength. Traders should be cautious and consider the potential for further declines towards the $0.01060 level.
Potential Scenarios:
Bearish Continuation: If Notcoin breaks below the $0.01159 support, it is likely to accelerate its decline towards the $0.01060 target. This scenario is strongly supported by the bearish Luftwing pattern and the overall market structure.
Temporary Rebound: Should the $0.011 support hold, there could be a brief rebound. However, the upside may be limited by the resistance at $0.01230, where sellers are likely to reassert their dominance.
Conclusion:
Notcoin is at a critical juncture, with the next few trading sessions likely to determine its short-term direction. The bearish Luftwing candle structure on the 4-hour chart suggests that a move towards the $0.01060 target is probable. Traders should closely monitor the key support and resistance levels and be prepared for increased volatility as the market reacts to these technical signals.

NOTCOIN: Looks Promising!Hello traders,
Welcome to this long-term analysis on NOT.
NOT is one of the meme coin projects with good potential for 3x-6x gains in the upcoming altseason. Currently, the price has rebounded from the support level at $0.00847, and it is likely to test the resistance trendline at $0.0148.
A breakout above the resistance trendline will most likely trigger a move toward the all-time high range.
- Accumulating this token at any lower price or CMP will be good enough.
- Support: $0.00847.
- Resistance (Current): $0.0148.
- Higher Resistance: $0.03.
Note: Do your own research before investing.
Trade safely.

Notcoin (NOT): Possible Break Of Lows / Drop Incoming? Notcoin has made a small but nice recovery from our last downward movement here, where price moves account for almost 50% of market price movement.
As of now, we are getting closer and closer to the end phase, where resistance and support will be closer to each other, meaning we are pressing the price of NOT at that point.
We are looking here for a break of support to happen, which would start a movement to further lows of Notcoin so we keep our eyes on support for now!
Swallow Team

NOTUSDT Daily OutlookNotcoin was created by Open Builders, developers of the TON blockchain. NotCoin integrates game-like elements into its ecosystem, encouraging user engagement and participation through challenges, achievements, and rewards. NotCoin’s rise to 4 million players is a testament to its innovative approach to digital assets.
Notcoin component is an interactive button that reacts to the user's touches with animations and dynamic updates.
Telegram Mini Apps (TMA) are web applications that run inside the Telegram messenger. This is a basic and straightforward Telegram Mini App(TMA) implemented using plain JavaScript, HTML, and CSS.
The bullish invalidation can happen if the pair closes below $0.0080. On the lower side, the near-term support is $0.011.Any close below targets $0.010/0.0080.
The pair's near-term resistance is around $0.01350. Any breach above confirms minor bullishness. A jump to $0.0150/$0.01795 is possible. A surge past $0.0180 will take it to $0.0200/$0.02180.
It is good to buy on dips around $0.0100 with SL around $0.0080 for TP of $0.0200.

NOT - BEST area for LOWn at $0.09NOT - BEST area for LOWn at $0.09
Statistically when we take trade -the best are for entry VAH or VAL
In this case we look for lONG
Price already did big bounce in a case of re-test of VAL $0.09 we`ll buy this coin

Notcoin NOT price is preparing for a new wave of growthThe OKX:NOTUSDT price has been behaving quite well in recent weeks and has been harmoniously correcting itself after the rapid 1st wave of growth.
At what level are you ready to sell your CRYPTO:NOTUSD ?
- NOT price - $0.019 - Notcoin capitalization - $2 billion
- NOT price - $0.029 - Notcoin capitalization - $3 billion
- NOT price - $0.09 - Notcoin capitalization - $9.5 billion

NOTUSDT Analysis: Short-Term Bearish Move Before Expected UpsideHello Traders,
I'm closely monitoring NOTUSDT, and I foresee a short-term bearish move before an upside correction.
Key Levels:
Current Price: 0.01160
Support Level: 0.011
Resistance Level: 0.012
Analysis:
Price Action: The price is likely to drop to the 0.011 region, where we might see strong buying interest stepping in. This level has acted as a crucial support in the past.
Indicators:
RSI: Nearing oversold conditions, which could suggest a potential reversal after the anticipated dip.
MACD: Currently bearish, supporting the expectation of a drop before any correction.
Volume: Watch for a spike in volume as the price approaches the 0.011 level, which could indicate the start of buying pressure and a possible reversal.
Strategy:
Entry Point: Consider buying around the 0.011 support level, looking for signs of reversal or consolidation. This could be a good entry point for a short-term trade.
Target: 0.012. This is a key resistance level and the expected target for the upside correction.
Stop Loss: Consider placing a stop loss below 0.0108 to manage risk effectively.
Conclusion:
Keep an eye on the 0.011 level for potential buy opportunities. If the price holds at this support, we could see a corrective move back towards 0.012. As always, manage your risk and trade carefully.
Happy Trading!
@TheLastLuftwaffe

NOTUSDT: QUICK LONG TRADE SETUP#NOTUSDT long trade setup:
Breaking out of channel and taking support over 200 MA in hourly TF.
Entry: 0.011840 to 0.011704
Targets and SL are marked in chart.
Happy trading!!

Notcoin Price Forecast: Will NOT Surge Past Resistance?In the latest 4-hour chart analysis of BINANCE:NOTUSDT , recent action showcases a mixture of cautious optimism and potential bullish momentum. Closing prices reveal a fluctuating trend with the latest price closing at $0.01176. This movement around the current levels suggests that traders are keeping a keen eye on significant support and resistance zones to determine the next direction.
The Notcoin price is currently facing resistance at $0.012908, with additional resistance levels observed at $0.01325 and $0.01388. The Notcoin price needs to break these barriers to confirm a sustained upward trend. On the downside, immediate support lies at $0.011665, followed by more substantial support levels at $0.01065 and $0.00939. Traders should monitor these levels closely, as a breach below the support could signal further declines.
Examining the 9 EMA and 20 EMA, a steady alignment can be seen, with the 9 EMA slightly above the 20 EMA, indicating a short-term bullish trend. This alignment is often considered a positive signal for traders looking to enter long positions. Additionally, the Moving Average Convergence Divergence (MACD) shows a bullish crossover, with the MACD line moving above the signal line and the histogram maintaining positive values. This development suggests increasing bullish momentum and potential upward price action.
The Relative Strength Index (RSI) fluctuates around the mid-50s to 60s range, currently at 54.97. An RSI above 50 typically indicates bullish momentum, but the values close to the neutral zone suggest caution. Traders should watch for RSI movements above 70, indicating overbought conditions, or below 30, suggesting oversold conditions.
For traders looking to enter long positions, a break above the $0.012908 resistance level could be a potential entry point, with targets set at $0.01325 and $0.01388. Conversely, short traders might consider entering if the price falls below the $0.011665 support, targeting the $0.01065 and $0.00939 levels for potential exits.

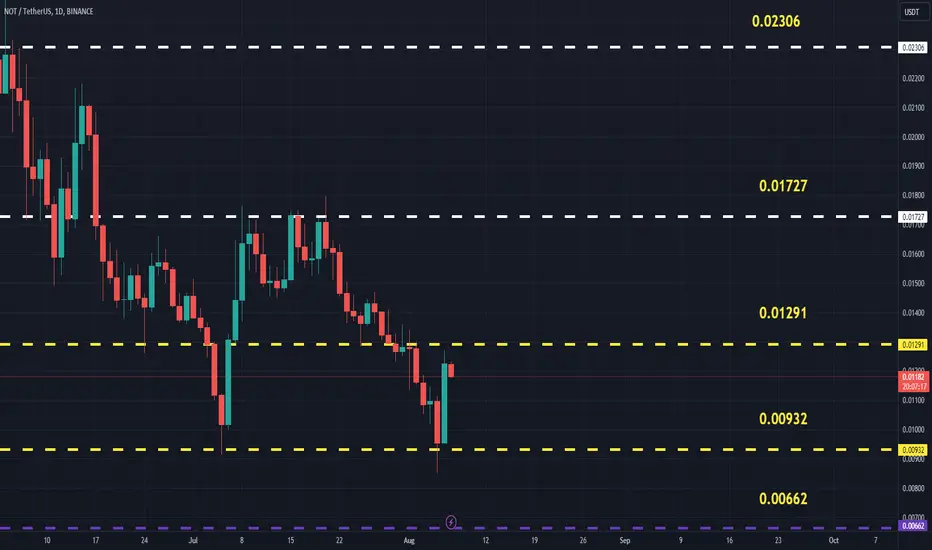
NOTUSDT(Notcoin) Updated till 07-08-24NOTUSDT(Notcoin) Daily timeframe range. PA is fairly new so there are lots of opportunity here from both sides. even tho market had trouble, the range played out well. now it did retraced from 0.00932 thats local low. trying to get to 0.01291 thats recent resistance.