BULLISH CONTINUATION BYBIT:NOTUSDT Has broken a significant trendline on the bullish wedge pattern which makes it a very significant movement for the price of Notcoin. As we can see the price of NOTCOIN has fallen by 75% from it's All time high of $0.035 to $0.009. Also in the course of this price drop, we could see the formation of a bullish wedge pattern which break above it on Saturday and we are currently trading within the range of $0.016 and $0.017.
For anyone looking to buy $NOTCOIN right now I suggest you wait for the price to retest the breakout around the price levels of $0.011 and $0.012, before we can start looking for buy positions..
NOTE! : THIS IS NOT A FINANCIAL ADVICE IS JUST FOR INFORMATIONAL AND EDUCATIONAL PURPOSE ONLY, DO YOUR OWN RESEARCH THANKS.
-PLEASE DO FOLLOW BOOST AND LIKE FOR MORE DAILY UPDATES.
NOTUST trade ideas

Notcoin (NOT): bullish rebound coming?NOT, a Telegram-based cryptocurrency, has seen a significant gain of 6% over the past day following the market rebound. The altcoin hovers above $0.016, indicating a strong upward trend in its trading patterns.
As of this writing, Notcoin price is $0.0164, surging 22% during European trading hours.
Notcoin is currently showing signs of a robust recovery, potentially signaling the onset of a bullish trend. Notcoin could break through the $0.016 resistance barrier if this momentum continues. This upward move propels its price towards $0.02 and could reach as high as $0.1 in the near future.
On the flip side, if the market sentiment deteriorates, Notcoin might stabilize around the $0.015 support level. In a sustained bearish phase, the price might drop to about $0.014. These fluctuations highlight the inherent volatility within the cryptocurrency market.
The 4-hour technical indicators for Notcoin (NOT) show a recent rebound after a continuous downward trend. The Relative Strength Index (RSI) indicates a value of 65.72, moving above the neutral 50 level, suggesting a growing bullish momentum. The RSI’s recent rise from a low of 69 points towards increasing buyer interest.
The Moving Average Convergence Divergence (MACD) has begun to show promising signs of a bullish crossover. The MACD line (blue) has moved above the signal line (orange), signaling a potential upward movement in price. The histogram also supports this outlook, transitioning from negative to positive bars, indicating a shift in momentum toward the buyers.
The Average Directional Index (ADX) remains high at 48.29, indicating a strong trend in the market.


Sideways movement to go further for upward movementExpecting NOT to go atleast to 0.01645 to follow the trend line and go up from there. If not breaks through it might go down further 0.0158
DYOR! This is no financial advice.

NOTCOIN Up 85% In Four Days. Targets & Trade Strategy.Traders,
So, two days after recommending, NOT coin had one last liquidation event before popping up and out of this bullish descending wedge nicely. It then proceeded to rally 85% from its wick low to its current price as of this post and a full 35% from where I recommended entry!
As I’ve stated previously, altcoins are few and far between right now for long entries. But there are a few you’ve heard me mention which have good setups. NOT coin was one of these and is why I entered initially.
If you are still looking to re-enter this coin, 15 cents appears to be a great level. You will see that volume has created a nice level of support at that price.
For those of you still in the trade, I have drawn four levels above my entry, the first level we’ve already hit at 15 cents. Target two comes at around 19 cents. Target three at 21. The final target is 25 cents plus.
Best of luck to you all!
Stay tuned and I’ll do some more analysis on some of my other recommendations, like BONK, up 15% today so far.
Stew

LONG #NOTUSDT1m TF. The asset is NOT one of the leaders in terms of trading volumes (2 billion) with upward movement dynamics. High activity on the part of buyers is manifested in price compression to the local resistance level. I expect the continuation of the upward structure and the breakdown of the marked level with a good risk-profit ratio on the activity in the order book.

NOT Flashes Bullish Power Scalper Signal On The 4H Chart — 17% PCurrent Status 📊
GETTEX:NOT has delivered an outstanding performance for the last few days. However, the rally might continue based on the latest Power Scalper signal.
The Signal ⚡️
NOT flashed the signal on the 4H chart, indicating a potential of more than 17%. Unfortunately, there is not enough data to provide solid backtest data for NOT. Nevertheless, the signal generally has solid reliability on the 4H chart.
What About The Chart 📉
The signal fits perfectly into the current chart setup: The profit potential points to the resistance at $0.02. Therefore, the idea of the current signal is to ride the wave back to the resistance.

NOTCOIN (NOTUSDT): Back to Bullish Trend?! NOTCOIN is showing signs of a recovering after a prolonged period of bearish activity.
There has been a clear breakout above a significant daily resistance level, indicating strong buying pressure.
I anticipate that the market will continue to recover and potentially reach the 0.021039 area in the near future.

$NOT - Bullish FlagNOT brokeout from bullish flag formation and looks like the retest already done.
Bullish for me and I am loiking for a good entry for long position at around 0.016132 - 0.014990
Always dyor and use stop loss whatever your position

What Happens in NOTCOIN?By carefully examining the chart of Notcoin, we can see the movements of whales so that they can own more circulating tokens , for this reason, I have a bullish view on this currency and I hope it reaches its first target.
For more explanation, I would like to say that creating a trap for buyers to hesitate and rush to buy, as well as creating fear for sellers and owners of Notcoin currency to sell, is a sign of an upswing and new Bullish Impulsive Leg.
Be patient and good luck

NOT coin analysis → after breakinghello guys.
poof! What a week!
apart from other coins, NOT coin was great and broke the descending channel.
it is forming a knife-up pattern RN! and we can expect another upward movement toward the next channel!
the blue area is assumed as target!
___________________________
✓✓✓ Always do your research.
❒❒❒ If you have any questions, you can write them in the comments below, and I will answer them.
❤︎ ❤︎ ❤︎And please don't forget to support this idea with your likes and comment


NOTHING !!BINANCE:NOTUSDT
The reasons I mentioned in the analysis before, the price increased after the wedge broke, and after the price correction wave, can reach the next targets.
✨Traders, if you liked this idea or have your opinion on it, write in the comments, We will be glad.
_ _ _ _ __ _ _ _ _ _ _ _ _ _ _ _ _ _ _ _ _ _ _ _ _ _ _ _ _ _ _ _
✅Thank you, and for more ideas, hit ❤️Like❤️ and 🌟Follow🌟!
⚠️Things can change...
The markets are always changing and even with all these signals, the market changes tend to be strong and fast!!

NOT NOT yoursthis coins is very strong and fast in recovery ,
its possible it go back down before flying up
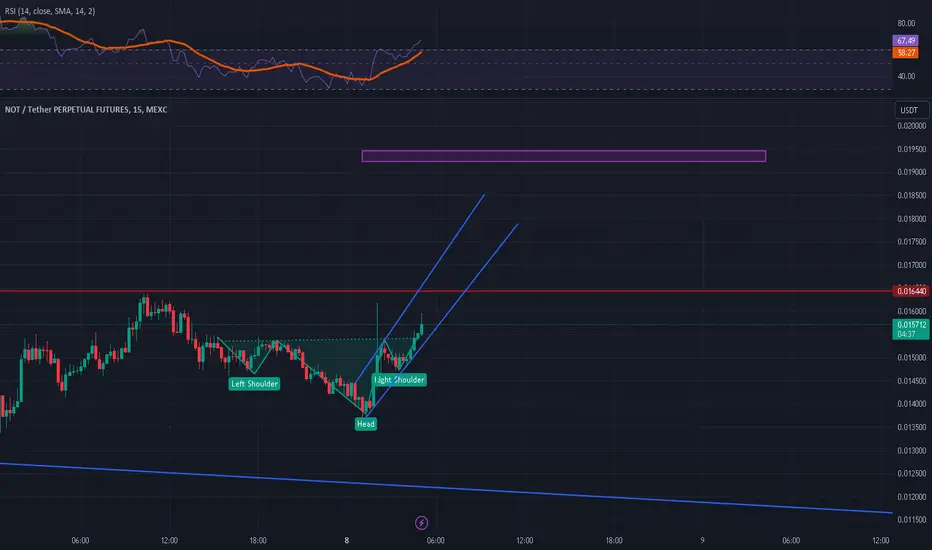
Not is at the right time to buy!Not seems like he rejected on the 0.0135 / 0.014 like I said in my last TA. Now going for a uptrend, reversed Shoulder Head Shoulder pattern expecting atleast 25% gain.
DYOR!!
NOTUSDT - Short trade setupNOT surged to an important swing high, where we faced strong resistance. The Fibonacci speed fan perfectly acted as resistance at the swing high, showcasing a textbook low-risk trade setup for an excellent R
short trade.
Given the resistance at the swing high, it looks like we're entering a range-bound phase, building up a trading range. Expect some sideways movement as the market consolidates and prepares for the next move. Using the Fibonacci retracement tool, we identify the Fib 0.382 level as our primary short trade target. This level is crucial as it often attracts liquidity.
If you missed the initial short entry at the highs, there are still great opportunities. Consider shorting at the Point of Control (POC) or at the Fib 0.618 level of the smaller wave. The Fib 0.382 level is also an area where liquidity lies, making it perfect for taking out some long positions built up at the swing high, with a target of the Fib 0.382 level as your take profit (TP) target.
What are your thoughts on this analysis? Did you catch the initial short trade or are you eyeing the secondary entries? Share your insights and strategies below!

NotcoinMy idea about notcoin!
I think we have a sell position according to H&S pattern & then the way to the mooooon! ;)

A SELL After Test of Resistance with a candle stick pattern A sell after a test of a resistance and candle stick pattern of Engulfing

Not the right time to longNot rejected from the 0.016 and now shows a shoulder head shoulder and a descending triangle pattern. Might go back to 0.0135 / 0.014 to try again from there.

NOTUSDT - Short Trade Setup Amidst Swing High ResistanceNOT surged to an important swing high, where we faced strong resistance. The Fibonacci speed fan perfectly acted as resistance at the swing high, showcasing a textbook low-risk trade setup for an excellent R
short trade.
Given the resistance at the swing high, it looks like we're entering a range-bound phase, building up a trading range. Expect some sideways movement as the market consolidates and prepares for the next move. Using the Fibonacci retracement tool, we identify the Fib 0.382 level as our primary short trade target. This level is crucial as it often attracts liquidity.
If you missed the initial short entry at the highs, there are still great opportunities. Consider shorting at the Point of Control (POC) or at the Fib 0.618 level of the smaller wave. The Fib 0.382 level is also an area where liquidity lies, making it perfect for taking out some long positions built up at the swing high, with a target of the Fib 0.382 level as your take profit (TP) target.
What are your thoughts on this analysis? Did you catch the initial short trade or are you eyeing the secondary entries? Share your insights and strategies below!

Will the Notcoin Price Boom Continue? Don’t Miss This!OKX:NOTUSDT has shown significant movement on the 4-hour chart, indicating potential opportunities for traders.
Recently, NOT has experienced a noticeable uptick in its closing prices, moving from $0.01139 to $0.01631. This upward trend suggests growing market interest and buying pressure. Key resistance levels to watch are $0.016314, $0.018238, and $0.01923. If the Notcoin price can break through these levels, it could signal further bullish momentum.
On the downside, crucial support levels are identified at $0.01536, $0.015096, and $0.015084. These levels could provide strong buying opportunities for traders looking to enter the market on a dip. Maintaining these support levels is vital for sustaining the bullish trend.
The 9 EMA and 20 EMA are both trending upwards, with the 9 EMA leading the 20 EMA. This crossover is generally seen as a bullish signal, indicating that the short-term momentum is favoring buyers. The increasing distance between these EMAs further strengthens the bullish sentiment.
Meanwhile, the MACD indicator also supports this positive outlook. Recently, the MACD line has crossed above the signal line, and the histogram has consistently shown positive values, suggesting increasing bullish momentum. This upward crossover is a strong indicator of potential continued price appreciation.
The RSI is currently at 75, which is in the overbought territory. While this indicates strong buying interest, it also suggests that the asset might be due for a short-term correction or consolidation. Traders should be cautious of potential pullbacks and consider this when planning their entry and exit points.
Potential Trade Approaches
For traders looking to go long, an ideal entry point would be at or near the support levels of $0.01536 or $0.015096. These levels provide a good risk-reward ratio, with potential exits at the resistance levels of $0.016314, $0.018238, and $0.01923. Setting stop-loss orders slightly below the support levels can help manage risk.
For those considering short positions, entering around the resistance levels could be strategic, especially if there are signs of the price struggling to break through these barriers. Targets for short trades could be set around the support levels, with stop-loss orders placed just above the resistance to limit potential losses.
In summary, the technical analysis of NOT on the 4-hour chart indicates a predominantly bullish trend supported by moving averages, MACD, and RSI indicators. Traders should monitor the key support and resistance levels closely to make informed decisions. As always, it is crucial to exercise caution and use appropriate risk management strategies.

notcoinNotCoin has reached the supply range in a downward trend, and we expect a price correction and fall from this area

#NOT Spot Opportunity #NOT Spot Opportunity.
1●-Mark Buy
2●-Limit Buy - 0.01444
3●-Limit Buy - 0.01123
Breakout of falling wedge
Breakout of residence
Breakout of high volume
Breakout of MA
