Notcoin(NOT) Analysis==>> Symmetrical TriangleNotcoin(NOT) is moving in a Symmetrical Triangle Pattern .
According to the theory of Elliott waves , it seems that Notcoin(NOT) is completing the last wave(Y) of the Double Three Correction(WXY) .
I expect Notcoin(NOT) to break down to at least the Support zone and the Uptrend line .
Note: If Notcoin(NOT) is able to break the support zone, we can expect more dumps.
Note: An important point you should always remember is capital management and lack of greed.
Notcoin(NOT) Analyze (NOTUSDT), 15-minute time frame ⏰.
Do not forget to put Stop loss for your positions (For every position you want to open).
Please follow your strategy; this is just my Idea, and I will gladly see your ideas in this post.
Please do not forget the ✅' like '✅ button 🙏😊 & Share it with your friends; thanks, and Trade safe.
NOTUST trade ideas

NOTCOINImportant ranges for the price reaction of this cryptocurrency, which has recently recorded a return of over 200 percent
Support: 0.021233
resistances and the next goal =
0.024971-0.028191

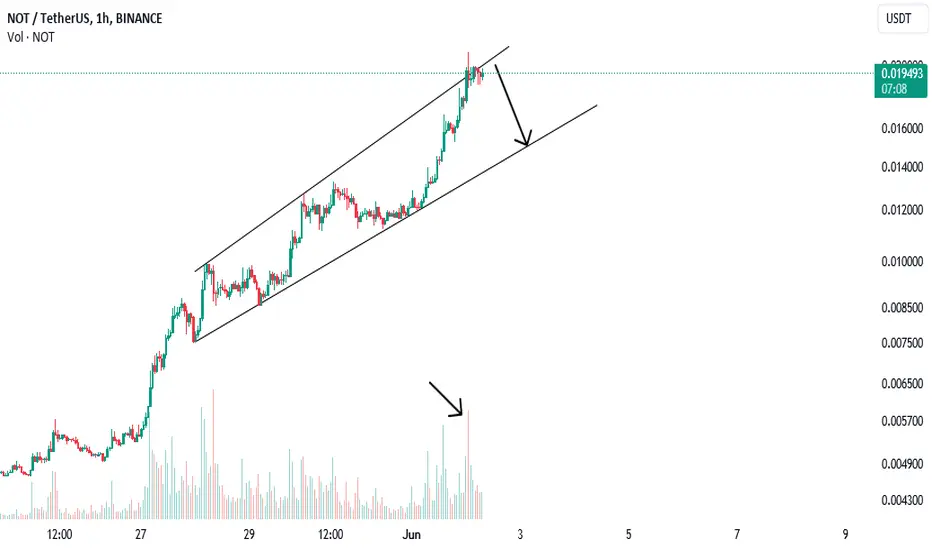
NOTUSDT ShortThe trendline is broken and after confirming the 2-hour time frame, we expect a fall to the specified range

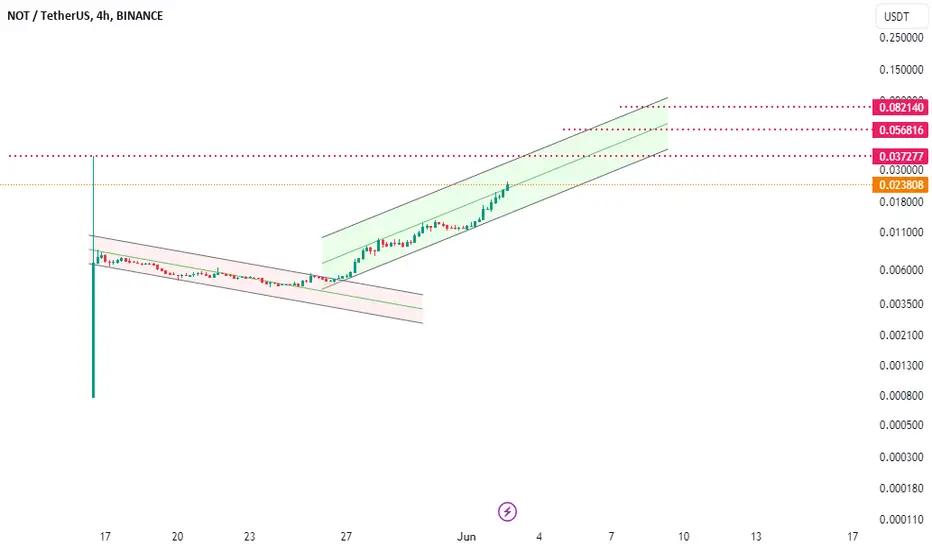
Technical Analysis of NOTUSDT.P on the 4h chartTechnical Analysis of NOTUSDT.P on the 4h chart
Current Situation
Current Price: 0.021313
Chart Time Frame: 4 hours
Bollinger Bands (21, 2)
Lower Band: 0.007565
Middle Band : 0.017023
Upper Band: 0.026481
Key Levels
Support: 0.020353
Resistance: 0.024051
Historical Context
Last Overbought: 2nd June 2024, with the price above 0.017313
Technical Analysis
Current Price Relative to Bollinger Bands:
The current price of 0.021313 is above the middle band (0.017023) but below the upper band (0.026481), indicating that it is in the upper half of the Bollinger Bands range. This suggests moderate bullish momentum.
Support and Resistance:
The price is close to the support level of 0.020353, which may act as a floor preventing the price from falling further.
The resistance level at 0.024051 is relatively close, indicating a potential short-term upside if the price can break through this level.
Recent Overbought Condition:
The last overbought condition was on 2nd June 2024, when the price was above 0.017313. This suggests that the price has experienced significant upward movement since then, but it's currently not in the overbought territory.
Potential Scenarios
Bullish Scenario:
If the price continues to rise and breaks the resistance at 0.024051, it could signal a continuation of the upward trend. The next target would be approaching the upper Bollinger Band at 0.026481.
Bearish Scenario:
If the price fails to hold above the support level of 0.020353, it could signal a potential reversal or consolidation. In this case, the price might test lower levels closer to the middle Bollinger Band at 0.017023.
Conclusion
Currently, NOTUSDT.P shows signs of bullish momentum as it trades above the middle Bollinger Band and near its support level. Watching the resistance level at 0.024051 will be crucial for determining the next movement. A break above this resistance could confirm the continuation of the upward trend, while a failure to hold the support might lead to a pullback towards the middle band.
Disclaimer:
This analysis is for informational purposes only and should not be considered financial advice. Trading cryptocurrencies involves significant risk, and you should consult with a qualified financial advisor before making any investment decisions.

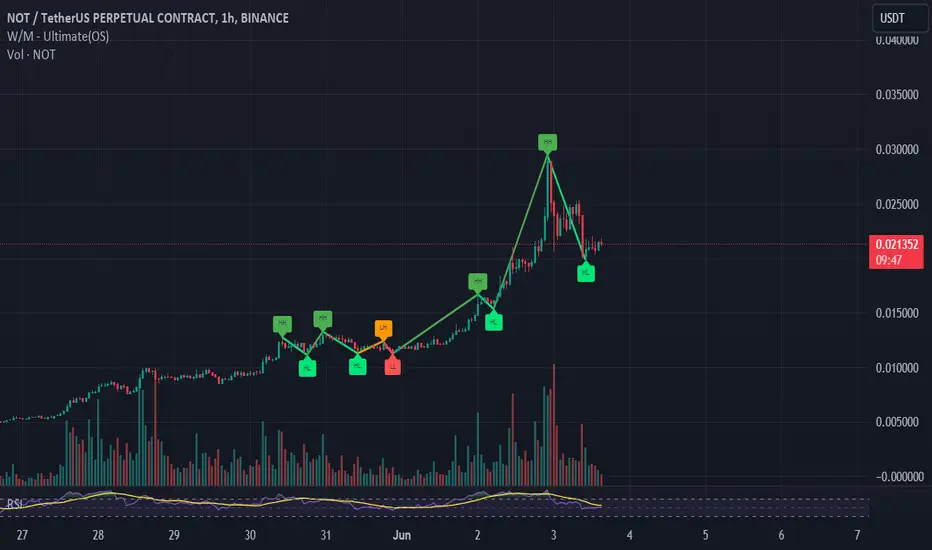
Notcoin(NOT) needs Correction ===>>-30%Notcoin(NOT) is up more than +30% , as I expected in yesterday's post .
According to the theory of Elliot waves , it seems that the main wave 5 has ended, and the confirmation sign of the end of wave 5 can be the breaking of the Uptrend line .
I expect Notcoin(NOT) to correct at least -30% and fall into the support zone .
Note: An important point you should always remember is capital management and lack of greed.
Notcoin(NOT) Analyze (NOTUSDT), 1-hour time frame ⏰.
Do not forget to put Stop loss for your positions (For every position you want to open).
Please follow your strategy; this is just my Idea, and I will gladly see your ideas in this post.
Please do not forget the ✅' like '✅ button 🙏😊 & Share it with your friends; thanks, and Trade safe.

We see the flag pattern on the notcoin chartHello friends
how are you
Continuing the previous analysis of the NOT currency, we see a flag pattern on the chart as shown in the figure and we expect the currency to grow up to 0.048.
***
Don't forget to like and comment.
***

The growth of the NOTCOIN currencyHello friends
How Are You
Considering that the NOTCOIN currency broke its downward trend line with a good volume and is now pullback to the trend line, we expect the growth of this currency up to the previous ceiling and if it breaks its previous ceiling, we expect higher growth.
Like & comment please.


NOTNOT is making Higher HIGH and higher low in 1 hour chart.
It already broken the channel, it can break it all time high.
Time for a breather24 hour trading volume is double of total market cap, RSI reached 90+.. .this rally is clearly overheated

NOTUSDT that is my ideaConsidering the market's excitement on this currency, I think the rise is more likely
let's see where it goes


The dragon comes in.What is evident in Natcoin is that it is completing the third wave, which can extend to the range of 0.029777--0.031587.If the third wave completes and confirms the bearish start of the fourth wave, there are two modes for correction in wave 4. Shaving up to the bottom of the trend line 2. A correction with a breakout of the trend line in the event of a breakout of the trend line will be possible to retrace to the area of 0.09370. But for wave 5 targets, important resistance zones have been identified, with the most important resistance facing the Nat Coin advance range of 0.051499--0.052799.

A PullBack Idea on NOTcoin | Updatewe can have a long trade in pullback! i try it :)
because of the high risk, This idea is'nt recommended, but it's suitable for the low volume of the test.
At the end of the week, NotCoin's movement will end with the closing of the one-day candle (as well as the weekly candle) in the price range of $0.03000.

NOTUSDT Potential Retracement and Rally to $0.03414 I'm observing the price action of NOTUSDT and it appears there may be a short-term retracement before continuing its upward trajectory. Based on the Fibonacci retracement tool, I'm anticipating a pullback to around $0.021123 or $0.019855, which will present an excellent buying opportunity for the next leg up targeting $0.03414.
Chart Analysis:
Current Price Action:
The price of NOTUSDT is currently trading around $0.02402 after reaching a recent high.
The recent price movement suggests a potential retracement is on the horizon.
Fibonacci Retracement Levels:
The retracement levels from the recent high indicate potential support zones where the price might find a reversal.
Key retracement levels to watch include:
0.5 Fib level at $0.024710
0.618 Fib level at $0.025849
The deeper retracement levels of 0.786 at $0.027456 and 1.0 at $0.029503
Expected Pullback Zones:
The price is likely to find support at the 0.5 Fib level ($0.024710) or the 0.618 Fib level ($0.025849).
For a more pronounced correction, I'm watching the 0.786 Fib level at $0.027456 and the 1.0 Fib level at $0.029503.
These zones are marked by the blue arrows on the chart as potential entry points for long positions.
Ideal Entry Points:
The best entry points for long positions are around $0.021123 (0.618 retracement level) and $0.019855 (0.786 retracement level).
These levels offer a favorable risk-reward ratio and align with historical support zones.
Bullish Reversal and Target:
After the anticipated retracement, I'm expecting a bullish reversal that will propel NOTUSDT towards the 1.618 Fibonacci extension level at $0.03414.
This target aligns with the overall bullish trend and previous price action patterns.
Price Target:
My next major price target is the 1.618 Fibonacci extension level at $0.03414.
This level represents a significant resistance point where I expect the price to encounter selling pressure.
Conclusion:
NOTUSDT is showing signs of a potential retracement, presenting an excellent buying opportunity around $0.021123 or $0.019855. These levels are ideal for long entries, setting the stage for the next leg up towards the 1.618 Fibonacci extension target of $0.03414. Keep an eye on the support zones and be ready to enter long positions as the price approaches these key levels.
Happy Trading! 📈🚀

NOTUSDT 12H#NOTCOIN #NOT has the potential to reach $0.10
Oh my god! Really? Yes, mark my word. Do not all in it. Keep a bag of it for $0.10 target.
Targets:
$0.037000
$0.050000
$0.063000
$0.076900
$0.100000
Did you read my post carefully? Just hold a small bag of it. Do not put all of your funds on it. Do not be greedy.

CHANNELSDrawing channels are not reliable because of too little data, but maybe they reached a conclusion.
So don't take it too seriously
NOT/USDT set to break out to $0.05Title: NOT/USDT Poised for a Breakout to $0.05 🚀
Overview:
I've been closely monitoring NOT/USDT, and it has demonstrated a strong bullish trend, bouncing off significant support levels and breaking through key resistance points. Based on the Fibonacci retracement and extension levels, I'm projecting a target of $0.05.
Chart Analysis:
Current Price Action:
The price of NOT/USDT is currently trading at approximately $0.0211, showing significant upward momentum.
Recent bullish candles indicate strong buying pressure.
Fibonacci Retracement Levels:
I used the initial retracement from the recent low of $0.0044920 to the high of $0.0211711 to highlight critical support and resistance levels.
Key retracement levels to watch include:
0.382 Fib level at $0.009108
0.5 Fib level at $0.0092274
0.618 Fib level at $0.0103449
These levels have provided strong support during pullbacks, consolidating the bullish trend.
Fibonacci Extension Levels:
Using the Fibonacci extension tool, I project potential price targets for the continuation of the bullish trend.
Key extension levels include:
1.618 extension at $0.0191857 (already surpassed)
2.0 extension at $0.023435
2.618 extension at $0.0292865
3.618 extension at $0.0386624
4.618 extension at $0.0456128
Bullish Indicators:
The price has consistently broken through resistance levels, converting them into support.
The formation of higher highs and higher lows is a classic indicator of an ongoing uptrend.
The breakout above the 1.618 Fibonacci extension level indicates strong bullish momentum, setting the stage for higher targets.
Scalping Levels:
The blue arrows on the chart indicate potential buying levels for scalpers. These levels align with the Fibonacci retracement levels and provide ideal entry points for short-term trades.
Price Target:
Based on the current momentum and the Fibonacci extension levels, the next major target is the 4.618 extension level at $0.0456128.
A push beyond this level will likely see NOT/USDT reaching the psychological and technical milestone of $0.05.
Conclusion:
NOT/USDT is exhibiting strong bullish signals with the Fibonacci levels aligning perfectly with recent price actions. The breakout above critical resistance levels and the strong upward momentum suggest that the price could realistically reach $0.05 in the near future. I'll be watching for continued support above the 1.618 and 2.0 Fibonacci extension levels, as these will be key indicators of sustained bullish strength.
Happy Trading! 📈🚀


With for not koinI expect such a move from Not Koin,
NatCoin's RSI has gone up a lot, which indicates its correction

Nothing !!Hi.
COINEX:NOTUSDT
The price has reached the top of the channel and continues to climb after a small correction.
Traders, if you liked this idea or have your opinion on it, write in the comments, We will be glad.
_ _ _ _ _ _ _ _ _ _ _ _ _ _ _ _ _ _ _ _ _ _ _ _ _ _ _ _ _ _ _ _ _
✅Thank you, and for more ideas, hit ❤️Like❤️ and 🌟Follow🌟!
⚠️Things can change...
The markets are always changing and even with all these signals, the market changes tend to be strong and fast!!

NOTHINGNOTCOIN formed a rounding bottom on weekly timeframe🤔
breakout it happened
✅ Due to the Ascending structure of the chart...
- High potential areas are clear in the chart.
- AB=CD
- Rounding Bottom
Stay awesome my friends.
_ _ _ _ _ _ _ _ _ _ _ _ _ _ _ _ _ _ _ _ _ _ _ _ _ _ _ _ _ _ _ _ _
✅Thank you, and for more ideas, hit ❤️Like❤️ and 🌟Follow🌟!
⚠️Things can change...
The markets are always changing and even with all these signals, the market changes tend to be strong and fast!!
