a great rising can happen !#NOT made a huge correction which grabbed the liq at the bottom of the market so it can make a big rise now but there is also a worse plan which is making a bigger correction but as the liq is caught i dont believe in market crash anyway set your sl always and avoid high risk trades !
NOTUST trade ideas

notcoin idea"🌟 Welcome to Golden Candle! 🌟
We're a team of 📈 passionate traders 📉 who love sharing our 🔍 technical analysis insights 🔎 with the TradingView community. 🌎
Our goal is to provide 💡 valuable perspectives 💡 on market trends and patterns, but 🚫 please note that our analyses are not intended as buy or sell recommendations. 🚫
Instead, they reflect our own 💭 personal attitudes and thoughts. 💭
Follow along and 📚 learn 📚 from our analyses! 📊💡"

$NOT for Spot GETTEX:NOT is in a good range for buying. Be sure to buy some according to capital management and hold for a while. Also, fundamental news that has been published for your ecosystem can have a big impact on this currency.

Notcoin Continues Bullish (Update) —4X Lev. Trade IncludedThis is one of the strongest charts right now, before the action takes place. This is a great chart because it is early, above support (resistance conquered) with consolidation already over. This is going up.
➖ NOTUSDT (Notcoin) is looking great. Look at the black line on the chart. Check!
We are green. This pair is also trading above EMA55 and EMA89. Check! Check! Check!
We are ready;
The market is ready;
The chart is ready;
We are ready to win!
Imagine, we are doing 4X but this can be increased.
Leveraged trading is for experts only...
Full trade-numbers with targets can be found by following the trade-idea below:
You are appreciated, truly!
We are here long-term.
Thanks a lot for your continued support.
Win! Win! Win!
Patience is key!
Another great chart setup... You just need to trust me to succeed.
Namaste.

Nobody appreciates it !!!In the daily time frame, as you can see, there are two bullish patterns. The first one is a Wedge, and the second one is a H&S . If either of these patterns breaks, the price of notcoin can reach around $0.015 .
Give me some energy !!
✨We spend hours finding potential opportunities and writing useful ideas, we would be happy if you support us.
Best regards CobraVanguard.💚
_ _ _ _ __ _ _ _ _ _ _ _ _ _ _ _ _ _ _ _ _ _ _ _ _ _ _ _ _ _ _ _
✅Thank you, and for more ideas, hit ❤️Like❤️ and 🌟Follow🌟!
⚠️Things can change...
The markets are always changing and even with all these signals, the market changes tend to be strong and fast!!

Lingrid | NOTUSDT Breakout Trade. Long from SUPPORT levelBINANCE:NOTUSDT successfully broke through the resistance level at 0.0100 after spending several weeks in a consolidation phase. This breakout, combined with a move above a trendline, is a bullish signal that could lead to further upward extension. If the market continues to gain momentum, an additional breakout above the previous month's high could indicate strong buying interest, potentially leading to a surge in price. If the price hold above 0.0100 and decisively clear the previous month's high, it might attract more buyers and push the price to higher levels. My goal is resistance zone around 0.01200
Traders, if you liked this idea or if you have your own opinion about it, write in the comments. I will be glad 👩💻

NOT USDTPossible reversal from this point as it clearly show strength in what supposed to be a strong resistance. Another support might be from TON ecosystem that is still underperformed. Will this be a good play? See you at ATH.

$NOT not rounded bottom pattern... bottom out! Uptrend...GETTEX:NOT Not is forming a bottoming pattern.... A rounded Bottom
Current price: 0.0099
NOT reached an all time high of 0.037 from this chart.
And has been steadily consolidating between a price low of 0.006 and current price.
A break out of current resistance 0.0099 can lead to prices 0.012, 0.017, 0.021, 0.025 and above.
Important: This idea on #NOT invalidates under 0.0086

#NOT 1D: Final Analysis – Targets on the Chart! 11/28/24NOT Coin – the leader among tap-to-earn applications, holds significant potential for growth. However, achieving upward momentum requires increased trading volumes and market activity. Ultimately, price movement depends on market makers, not individual traders like us. For now, it’s a waiting game.
I am using a laddering strategy for accumulation. Targets are outlined on the chart. This will be my final analysis on #NOT and should serve as a reference point—no further updates are planned.
DYOR.

Ready For Good Pump On NotCoinReady For Good Pump On NotCoin
Notusdt are in good price for buy and pumo from here
very good bullish pattern and break and pullback on pattern
break and pullback on EMA100 daily
every things is ready for pump
good luck guys

Notcoin such a clean journey to magical numbersChart shows everything.
Targets there for up only for swing position.
Buy it and hold it for couple of weeks for feastable profits

Notcoin Consolidation Phase Is Over: 600% Target MappedIt is done. It is over. NOTUSDT (Notcoin) is no longer moving within its consolidation zone, it is now in the bullish zone —still early.
Good afternoon my fellow Cryptocurrency trader, do you like Notcoin?
Do you enjoy profits and successful trades?
This can be a big one... Follow me!
We have a total of three signals confirming the bulls are in:
1) The 0.148 Fib. extension sits at 0.009057. Notcoin is now trading above this level. Bullish.
2) EMA89 and EMA55 have been conquered as resistance, a week ago. Bullish.
3) Notice the black line on the chart. This is our support baseline. Below this level NOTUSDT is bearish and consolidating. Notice how it moved lower in August when it traded below. Above this level, now, Notcoin is ready to grow. Bullish.
All these signals are pointing to higher prices. The other Altcoins are doing the same. Bitcoin is still trading pretty high after massive growth; Ethereum, Cardano, XRP, Dogecoin and all the giants as well. When the market grows it grows, we are entering a marketwide bull-market phase, this is the last chance to purchase any Cryptocurrency at low prices; the latter part of 2024.
We will see growth now and growth long-term. In 2025 we will have maximum speed and everything will become great.
We have multiple targets for this chart/pair/trade.
➢ First, 123% is an easy target and sits at 0.020279. Can be hit within days.
➢ Second is 0.044156 for a very nice 387%, great profits.
➢ Third and last, for this wave, we have 0.068033 and a huge 647%.
Notcoin can grow more, much more long-term.
This is not financial advice.
This is technical analysis at its best.
Simple and easy. Straight to the point.
We are aiming high...
Let's trade!
Thank you for reading.
Namaste.

NOT/USDT This analysis is suitable for users considering short-term trading.
English Analysis:
Chart Type and Timeframe:
The chart shows the "NOT/USDT" pair on Binance in a 15-minute timeframe. This indicates a short-term analysis.
Fibonacci Levels:
Fibonacci retracement levels are used. Key levels: 0.236 (0.009545), 0.382 (0.009607), 0.5 (0.009660), 0.618 (0.009716), and 0.786 (0.009792).
The 0.618 level is typically considered the strongest resistance or support, and price is likely to consolidate here.
Current Price Status:
The price is currently at 0.009489 and showing a bearish trend, indicating short-term selling pressure.
Trendline and Support:
The blue trendline represents an upward trend, but the price is now approaching this line. If it breaks below, the next support could be the 1.618 extension level at 0.009220.
Bullish/Bearish Expectation:
The price is moving between the 0.5 and 0.618 levels. If the 0.618 level is broken upward, the next targets could be 0.786 (0.009792) and 1.0 (0.009883).
However, the current trend appears bearish. If the downward movement continues, there’s potential for the price to drop toward the 2.618 level (0.008868).

99% profit on NOT !#NOT has a potential for rising as you can see there are stacked levels above which the market can grab there should be about 100 % profit check out my analysis before hitting the demand zone !

(Update) !!!In the 6-h time frame, the 5th upward wave has completed, and it's time for a price correction. Additionally, a bearish divergence has emerged, which strengthens this signal. The price can correct down to the shown trendline.
previous analysis
Give me some energy !!
✨We spend hours finding potential opportunities and writing useful ideas, we would be happy if you support us.
Best regards CobraVanguard.💚
_ _ _ _ __ _ _ _ _ _ _ _ _ _ _ _ _ _ _ _ _ _ _ _ _ _ _ _ _ _ _ _
✅Thank you, and for more ideas, hit ❤️Like❤️ and 🌟Follow🌟!
⚠️Things can change...
The markets are always changing and even with all these signals, the market changes tend to be strong and fast!!

The last bullish chance of Notcoin in mid-term !!Finally, the wedge broke .The price can reach the shown targets. That's it.
Give me some energy !!
✨We spend hours finding potential opportunities and writing useful ideas, we would be happy if you support us.
Best regards CobraVanguard.💚
_ _ _ _ __ _ _ _ _ _ _ _ _ _ _ _ _ _ _ _ _ _ _ _ _ _ _ _ _ _ _ _
✅Thank you, and for more ideas, hit ❤️Like❤️ and 🌟Follow🌟!
⚠️Things can change...
The markets are always changing and even with all these signals, the market changes tend to be strong and fast!!

NOT can fly !#NOT made lots of reactions to last demands on the rising spike as you can see below the last demand finally make a bigger rise
past demands only made correction waves

Breaking: Binance Delists Notcoin (NOT) — What Next? Binance Delists NOT/BNB Pair: A Blow to Notcoin's Momentum?
In a surprising move, Binance announced the delisting of the NOT/BNB and RDNT/BTC pairs, raising questions about the future of Notcoin (NOT). The decision, effective from December 6, aims to maintain a "high-quality trading market" and protect user interests. This delisting has sparked concerns among investors about reduced visibility and liquidity, especially for the Telegram-based click-to-earn token, which had gained significant traction.
Technical Breakdown
As of writing, NOT is trading at $0.009433, down 0.32% and indicating bearish reversal signs. The Relative Strength Index (RSI) stands at 61, suggesting a possible cool-down from previous highs. Despite this, NOT has shown resilience, up 1.98% in the last 24 hours, defying typical delisting-induced sell-offs. Traders should remain cautious, watching for a potential break below key support levels that could trigger further declines.
Broader Market vs. Project Potential
Notcoin's roots in the viral Telegram game helped it amass a dedicated user base, blending gaming and crypto. Its tap-to-earn model introduced many users to Web3, fostering engagement and community interaction. Beyond gaming, NOT's integration into the Telegram ecosystem highlights its broader utility for transactions and promotional campaigns for Web3 projects.
However, Binance's move could dampen this momentum. Reduced market visibility might slow adoption unless other exchanges or community initiatives pick up the slack. Meanwhile, Binance has expanded support for tokens like KAIA and AERO, reflecting a strategic pivot towards newer assets.
Market Sentiment: Mixed Reactions and Future Prospects
Despite the delisting news, NOT saw a 3% price uptick, indicating investor resilience or speculative buying. This reaction contrasts with typical bearish trends following exchange delistings, suggesting underlying optimism within the community. Meanwhile, increased trading activity for KAIA and AERO shows that delistings aren't universally detrimental if a strong community or utility backs the project.
Conclusion
The delisting could challenge Notcoin's immediate future, but its community-driven foundation and utility within the Telegram ecosystem remain strengths. Investors should monitor technical indicators closely while considering the broader market's bullish sentiment. If NOT holds key support levels, it could weather this storm and emerge stronger with strategic partnerships or listings on other platforms.
Stay informed: Market dynamics are shifting, and staying updated is key. 🚀

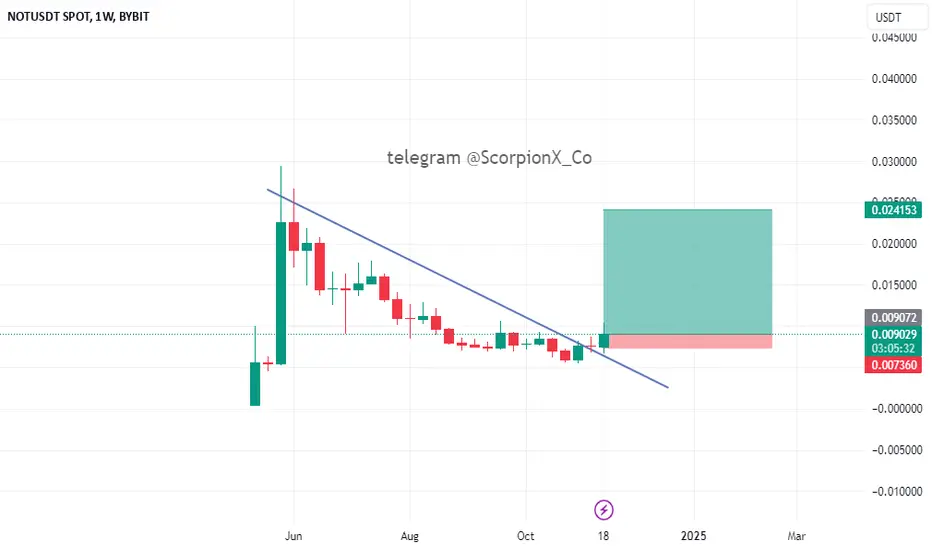
notcoin weekly movementafter a deep corrective movement by reaching RSI over sold area it was supported and by candle 4 and 18 november broke up the descending trend line but stopped after reaching the first static resistance area made by candle 23 sep . If the price could break up the first static resistance line so it would be an important signal of turning the down trend into up trend .
studying the moving averages shows that the price is blow the 21 ema which is as the same area as the first static resistance line.
also the there is a positive divergence between price and momentum indicator that says the momentum or acceleration is increasing . so we can consider it as a positive sign for possible up trend movement.
first stop loss : the candle 18 nov
second stop loss : 4 nov candle
first target point : the candle 15 july 2024

NOT NEW SETUP (12H)This analysis is an update of the analysis you see in the "Related publications" section
We have already bought in the green zone at the bottom and are still waiting for the pump, as the movement of this altcoin remains valid.
In the previous analysis, we identified entry points for those who missed the initial buy, but the price did not reach those levels.
By reviewing the chart, we realized that orders have been well transferred from the weekly order block to higher nodes, so we can buy again in the green zone.
The targets and the invalidation level are marked on the chart.
A daily candle closing below the invalidation level will invalidate this analysis.
The liquidity pools above the chart are still calling the candles!
For risk management, please don't forget stop loss and capital management
Comment if you have any questions
Thank You

NOTCOIN to the mooon !#NOT has a supper bullish pattern you may have some from its air drop or maybe you bought some after airdrop anyway it has hitted the demand zone and the dumping waves are over !

NOT is super bullish #NOT has made a very nice pattern as you can see there is a good correction in the market so the demand zone is being touched the target is 0.03 so if it goes there the profit is over 250 % !
