63 Moons : Approaching Red Band Resistance ( Monthly Time )63 Moons : Approaching Red Band Resistance.
(Monthly Time Frame)
( Not a Buy / Sell Recommendation
Do your own due diligence ,Market is subject to risks, This is my own view and for learning only .)
−7.20 INR
−331.70 M INR
468.20 M INR
19.35 M
About 63 MOONS TECHNOLOGIES LTD
Sector
Industry
CEO
Soundaram Rajendran
Website
Headquarters
Mumbai
Founded
1988
ISIN
INE111B01023
FIGI
BBG000F573H9
63 Moons Technologies Ltd. is a holding company, which engages in the provision of computer programming, consultancy, and related services. It operates through STP Technologies and Solutions; and Other segments. The STP Technologies and Solution segment represents straight through processing solutions and includes an integrated mix of various products, projects, and services. The Other segment consists of trading, procurement, process management, risk consultancy activities, shared business support services, IT infrastructure sharing, NBFC related activities, internet telecommunication services and training, and certification and franchise fees. The company was founded by Jignesh Prakash Shah and Dewang Neralla on April 12, 1988 and is headquartered in Mumbai, India.
Related stocks
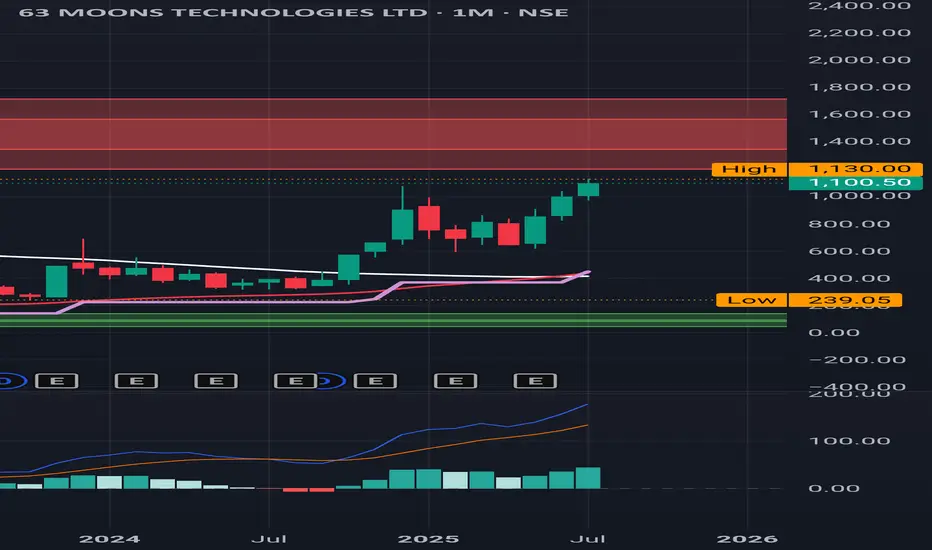
63 Moons : Monthly Time Frame. Red Band Resistance.
63 Moons : Monthly Time Frame. Red Band Resistance.
MACD looks extremely Strong .
( Not a Buy / Sell Recommendation
Do your own due diligence ,Market is subject to risks, This is my own view and for learning only
63 Moons PLAN FOR FUTURE INVESTMENTThanks for stopping by.
All analysis here is done strictly from an investor’s perspective — focusing on risk, return, valuation, and potential upside.
The notes cover key details. I’ve backed every thesis with my own analysis — no fluff, just what matters to investors.
If you find the idea useful

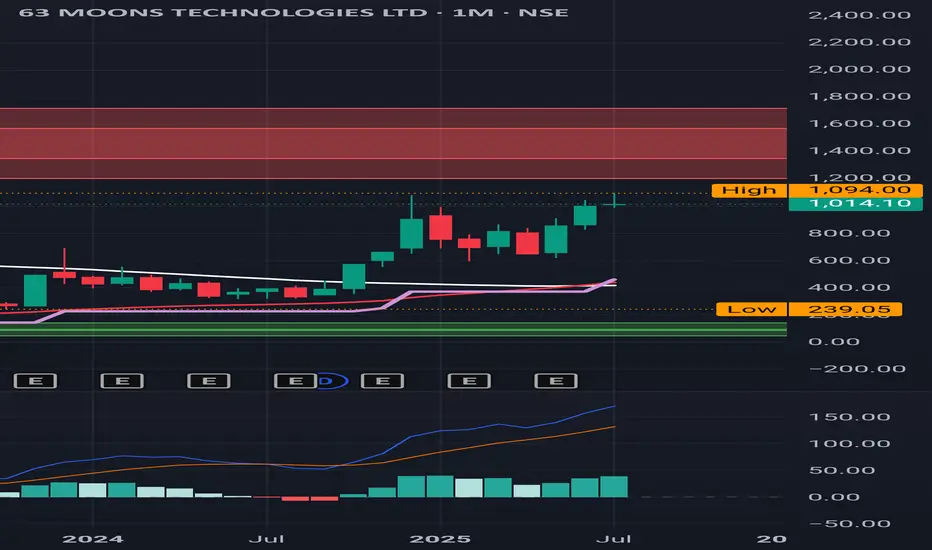
63 Moons : Sitting at the resistance 63 Moons : Sitting at the resistance.
If it clears this than the next level to be watched out for is 1000.
( Not a Buy / Sell Recommendation
Do your own due diligence ,Market is subject to risks, This is my own view and for learning only .)
63 Moons: Nice Rally after a Buy Signal,created a new resistance63 Moons: Nice rally after a buy a signal . Created a new resistance at 910 which needs to be watched out for.
( Not a Buy / Sell Recommendation
Do your own due diligence ,Market is subject to risks, This is my own view and for learning only .)

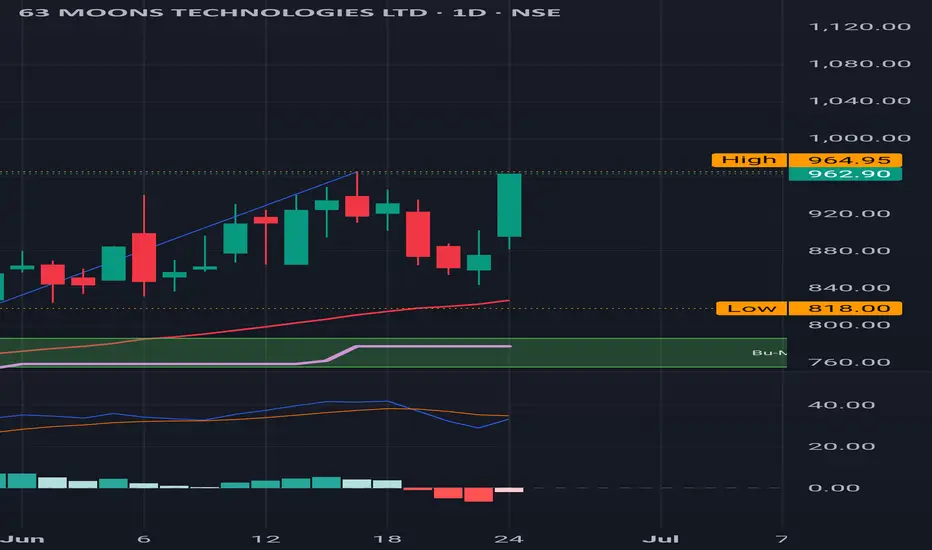
63 Moons : Continuing it's winning momentum after a Buy Signal63 Moons : Continuing it's winning momentum after a Buy Signal .
Last time it turned back from 864, which could be an important level to watch out for.
1070 is another major resistance if it crosses 1000 .
( Not a Buy / Sell Recommendation
Do your own due diligence ,Market is subject to risks

63 Moons : Buy triggered 63 Moons : Buy triggered
Levels to watch for are 845 & 865
( Not a Buy / Sell Recommendation
Do your own due diligence ,Market is subject to risks, This is my own view and for learning only .)

63 MOONS : Bounced back from the support 63 MOONS : Bounced back from the support of 676.
( Not a Buy / Sell Recommendation
Do your own due diligence ,Market is subject to risks, This is my own view and for learning only .)

63 Moons : Important day today63 Moons : Important day today as it broke a very strong resistance of 790.
Already in a Buy trajectory
MACD is very strong .
( Not a Buy / Sell Recommendation
Do your own due diligence ,Market is subject to risks, This is my own view and for learning only .)

63 MOONS TECHNOLOGIES LTD S/RSupport and Resistance Levels:
Support Levels: These are price points (green line/shade) where a downward trend may be halted due to a concentration of buying interest. Imagine them as a safety net where buyers step in, preventing further decline.
Resistance Levels: Conversely, resistance levels (re

See all ideas
Summarizing what the indicators are suggesting.
Oscillators
Neutral
SellBuy
Strong sellStrong buy
Strong sellSellNeutralBuyStrong buy
Oscillators
Neutral
SellBuy
Strong sellStrong buy
Strong sellSellNeutralBuyStrong buy
Summary
Neutral
SellBuy
Strong sellStrong buy
Strong sellSellNeutralBuyStrong buy
Summary
Neutral
SellBuy
Strong sellStrong buy
Strong sellSellNeutralBuyStrong buy
Summary
Neutral
SellBuy
Strong sellStrong buy
Strong sellSellNeutralBuyStrong buy
Moving Averages
Neutral
SellBuy
Strong sellStrong buy
Strong sellSellNeutralBuyStrong buy
Moving Averages
Neutral
SellBuy
Strong sellStrong buy
Strong sellSellNeutralBuyStrong buy
Displays a symbol's price movements over previous years to identify recurring trends.
Frequently Asked Questions
The current price of 63MOONS is 913.30 INR — it has decreased by −3.32% in the past 24 hours. Watch 63 MOONS TECHNOLOGIES LTD stock price performance more closely on the chart.
Depending on the exchange, the stock ticker may vary. For instance, on NSE exchange 63 MOONS TECHNOLOGIES LTD stocks are traded under the ticker 63MOONS.
63MOONS stock has fallen by −9.57% compared to the previous week, the month change is a −7.56% fall, over the last year 63 MOONS TECHNOLOGIES LTD has showed a 150.91% increase.
63MOONS reached its all-time high on Jun 29, 2007 with the price of 3,044.70 INR, and its all-time low was 39.55 INR and was reached on Mar 25, 2020. View more price dynamics on 63MOONS chart.
See other stocks reaching their highest and lowest prices.
See other stocks reaching their highest and lowest prices.
63MOONS stock is 5.30% volatile and has beta coefficient of 1.14. Track 63 MOONS TECHNOLOGIES LTD stock price on the chart and check out the list of the most volatile stocks — is 63 MOONS TECHNOLOGIES LTD there?
Today 63 MOONS TECHNOLOGIES LTD has the market capitalization of 42.08 B, it has decreased by −4.54% over the last week.
Yes, you can track 63 MOONS TECHNOLOGIES LTD financials in yearly and quarterly reports right on TradingView.
63MOONS net income for the last quarter is 109.95 M INR, while the quarter before that showed −166.79 M INR of net income which accounts for 165.92% change. Track more 63 MOONS TECHNOLOGIES LTD financial stats to get the full picture.
Yes, 63MOONS dividends are paid annually. The last dividend per share was 2.00 INR. As of today, Dividend Yield (TTM)% is 0.22%. Tracking 63 MOONS TECHNOLOGIES LTD dividends might help you take more informed decisions.
EBITDA measures a company's operating performance, its growth signifies an improvement in the efficiency of a company. 63 MOONS TECHNOLOGIES LTD EBITDA is −2.28 B INR, and current EBITDA margin is −508.81%. See more stats in 63 MOONS TECHNOLOGIES LTD financial statements.
Like other stocks, 63MOONS shares are traded on stock exchanges, e.g. Nasdaq, Nyse, Euronext, and the easiest way to buy them is through an online stock broker. To do this, you need to open an account and follow a broker's procedures, then start trading. You can trade 63 MOONS TECHNOLOGIES LTD stock right from TradingView charts — choose your broker and connect to your account.
Investing in stocks requires a comprehensive research: you should carefully study all the available data, e.g. company's financials, related news, and its technical analysis. So 63 MOONS TECHNOLOGIES LTD technincal analysis shows the sell today, and its 1 week rating is buy. Since market conditions are prone to changes, it's worth looking a bit further into the future — according to the 1 month rating 63 MOONS TECHNOLOGIES LTD stock shows the buy signal. See more of 63 MOONS TECHNOLOGIES LTD technicals for a more comprehensive analysis.
If you're still not sure, try looking for inspiration in our curated watchlists.
If you're still not sure, try looking for inspiration in our curated watchlists.