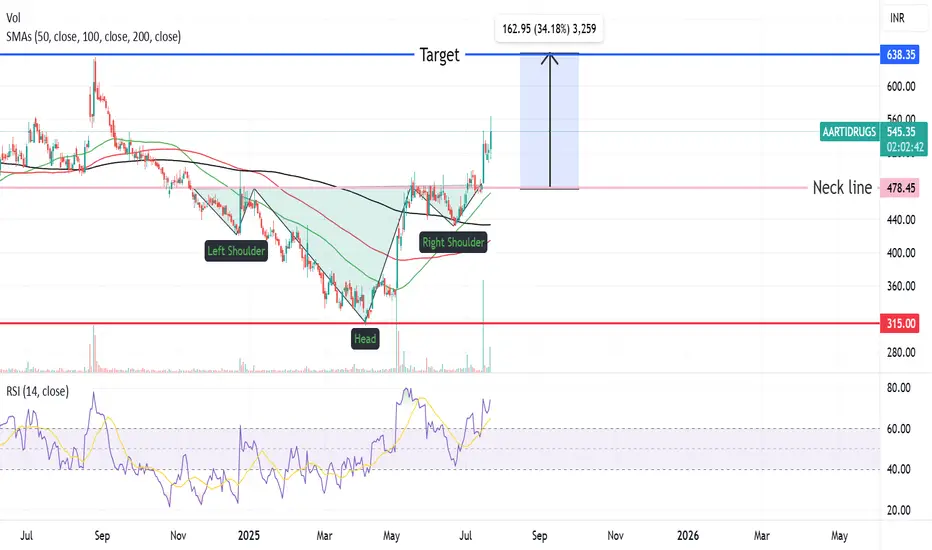
Aarti Drugs Reverse Head & Shoulder Pattern BreakoutAarti Drugs Reverse Head & Shoulder Pattern Breakout happened above neckline(478 Rs) .Target of this breakout will be arround 630 level with a stoploss of 470 level.
AARTIDRUGS trade ideas
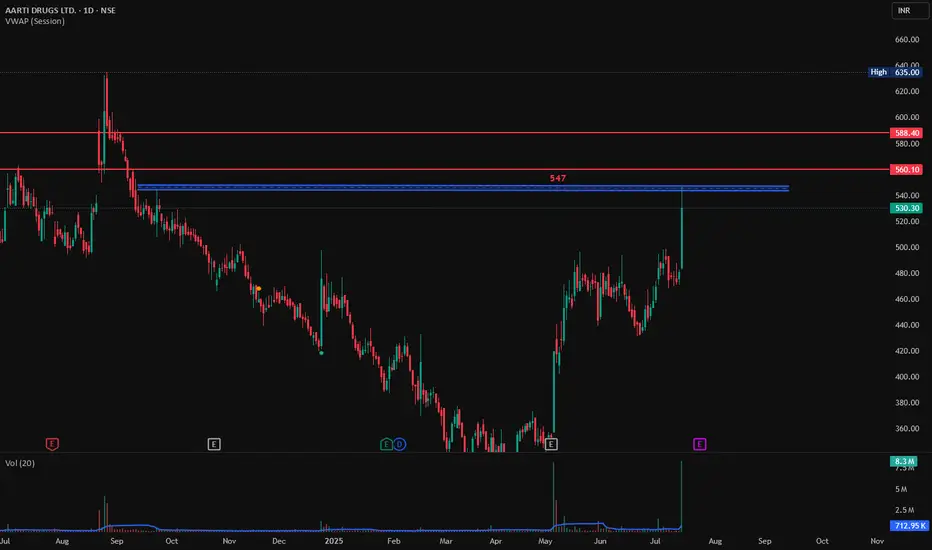
Aarti Drug Good Volume, breakout in 1D Time Frame, Long PositionAarti Drugs has shown a good upward move of 10% today with good volumes on 1 Day time frame. If its breaks the resistance at 547 with Bullish candlestick patterns like Bullish Engulfing, Hammer & Inverted Hammer, Piercing Line, Morning Star, Three White Soldiers, Tweezer Bottoms or Bullish Harami, then chances of going higher from here will increase.
Entry at 547 on Bullish Candlestick Pattern.
Target1: 560
Target2: 588
Stop Loss: 540
AARTI DRUGS LTD S/R Support and Resistance Levels:
Support Levels: These are price points (green line/shade) where a downward trend may be halted due to a concentration of buying interest. Imagine them as a safety net where buyers step in, preventing further decline.
Resistance Levels: Conversely, resistance levels (red line/shade) are where upward trends might stall due to increased selling interest. They act like a ceiling where sellers come in to push prices down.
Breakouts:
Bullish Breakout: When the price moves above resistance, it often indicates strong buying interest and the potential for a continued uptrend. Traders may view this as a signal to buy or hold.
Bearish Breakout: When the price falls below support, it can signal strong selling interest and the potential for a continued downtrend. Traders might see this as a cue to sell or avoid buying.
MA Ribbon (EMA 20, EMA 50, EMA 100, EMA 200) :
Above EMA: If the stock price is above the EMA, it suggests a potential uptrend or bullish momentum.
Below EMA: If the stock price is below the EMA, it indicates a potential downtrend or bearish momentum.
Trendline: A trendline is a straight line drawn on a chart to represent the general direction of a data point set.
Uptrend Line: Drawn by connecting the lows in an upward trend. Indicates that the price is moving higher over time. Acts as a support level, where prices tend to bounce upward.
Downtrend Line: Drawn by connecting the highs in a downward trend. Indicates that the price is moving lower over time. It acts as a resistance level, where prices tend to drop.
Disclaimer:
I am not a SEBI registered. The information provided here is for learning purposes only and should not be interpreted as financial advice. Consider the broader market context and consult with a qualified financial advisor before making investment decisions.
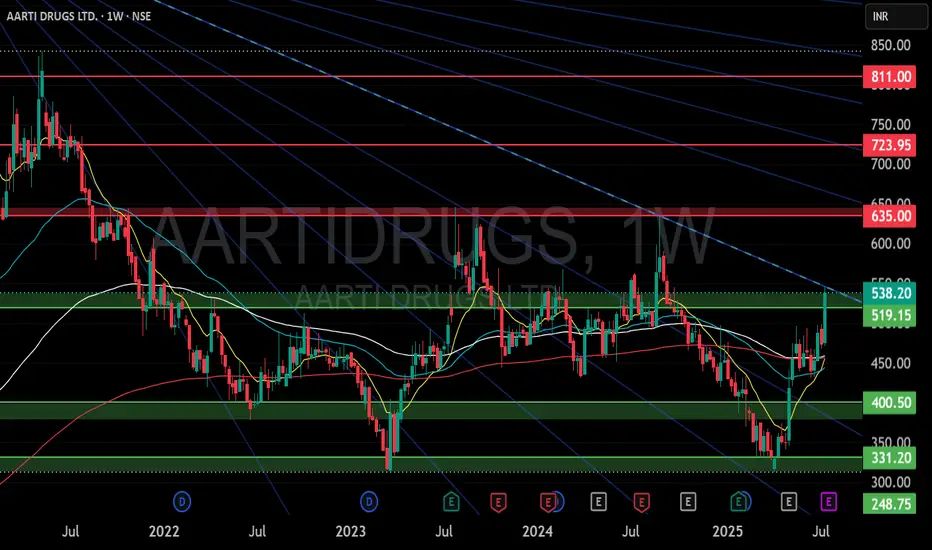
AARTI DRUGS at Best Support !!This is the Weekly chart of AARTI DRUGS.
AARTI DRUGS having good law of polarity at 425-440 range.
If this level is sustain then we may see higher prices in AARTI DRUGS.
Thank You !!

A technical trade short term AartiaDrugPrice is taking support multiple times at a single support line.....buying zone 453-458.....Target 1 is 543-554 and Target 2 is 604-608....sl closing below 436...only for educational purposes and not any recommendations.....

Aarti Drugs - Key Levels to WatchAarti Drugs - Key Levels to Watch 🔍
Aarti Drugs has shown some recovery after restoring production at its Tarapur unit, as per recent filings. Here’s the technical outlook:
1.Fibonacci Retracement Levels:
Resistance at 0.618 (₹593) and 0.5 (₹676).
Immediate support near 0.786 (₹476).
2.Volume Profile:
High activity seen between ₹450-₹500. Sustained support in this zone is crucial.
3.RSI:
Current RSI shows a slight bullish divergence—monitor for a potential rebound.
Levels of Interest:
Upside Potential: ₹593 (618 Fib) and ₹676 (0.5 Fib).
Downside Support: ₹476 (786 Fib) and ₹450 (volume support zone).
Stay cautious as the stock consolidates. Monitor for clear directional moves above or below these levels.

Aarti drug breakout structureAarti drug can double from here with in few years. Sl below the trend line.
Chart is self explanatory. Please follow the price action & take the trade as per your appetite.
The information provided here is only for educational purpose. The information provided here is not intended to be any kind of financial advice, investment advice, and trading advice. Investment in stock market is very risky and trading stocks, options and other securities involve risk. The risk of loss in stock market can be substantial. Moreover, I am not a SEBI registered analyst, so before taking any decision or before investing in any Share consult your financial advisor and also do your analysis and research.
Request your support and engagement by liking and commenting & follow to provide encouragement.

Triangle Breakout After a Long Time...AARTI DRUGS try to attempt a Triangle Breakout after a long time. After a successful breakout you can watch for Swing Trade. Next resistence is at 800-900.


Aarti Drugs Bullish, Kindly do your own studyThis stock is looking bullish. Please do your study before taking any decision.
Monthly price is above 50 EMA and also above 5 EMA
After big rally ABC correction seems to be over
New impulse could be started. 1st wave has been completed and in 2nd wave also ABC seems to be over
Monthly MACD PCO above zero line
Weekly MACD PCO
Weekly RSI is above 50
Weekly price is above 50 EMA and golden crossover is happening
Daily price has given breakout
Daily RSI is above 60
Daily ADX
Volume is above average

AARTIDRUGS 1DAYNICE BREAKOUT
WAIT FOR THE RETEST
I Am Not SEBI Registered Analyst. All Post and Levels Posting is only for educational and knowledge purpose. I Am not responsible for your any kind of loss or profit.
No Claim, All Rights Reserved.‼️

Aarti Drugs giving signs of pennant Breakout. Aarti Drugs Limited (ADL) is a prominent manufacturer of APIs, Pharma Intermediates, and Specialty Chemicals. ADL engages in the development, manufacture and market of pharmaceutical products. The firm operates through the Out of India, and India geographical segments.
Aarti Drugs Limited (ADL) CMP is 495.70. The positive aspects of the company are Company with Low Debt, Growth in Quarterly Net Profit with increasing Profit Margin, Company with Zero Promoter Pledge, FII / FPI or Institutions increasing their shareholding, and Mutual Funds Increased Shareholding. The Negative aspects of the company are Decline in Quarterly Net Profit, MFs decreased their shareholding last quarter and Promoter decreasing their shareholding.
Entry can be taken after closing above 503 Targets in the stock will be 519 and 531. The long-term target in the stock will be 549 and 568. Stop loss in the stock should be maintained at Closing below 456.
The above information is provided for educational purpose, analysis and paper trading only. Please don't treat this as a buy or sell recommendation for the stock. We do not guarantee any success in highly volatile market or otherwise. Stock market investment is subject to market risks which include global and regional risks. We will not be responsible for any Profit or loss that may occur due to any financial decision taken based on any data provided in this message.

AARTIDRUGSPossible upside in Aarti Drugs as in wave 3 of Elliott Wave theory. May reach upto 950 by Dec'24.

AARTI DRUGS LTDAARTI DRUGS LTD
look good
above 512 big moves possible
one con is less volume
if volume increases from 1m to 3m it is good sign to buy


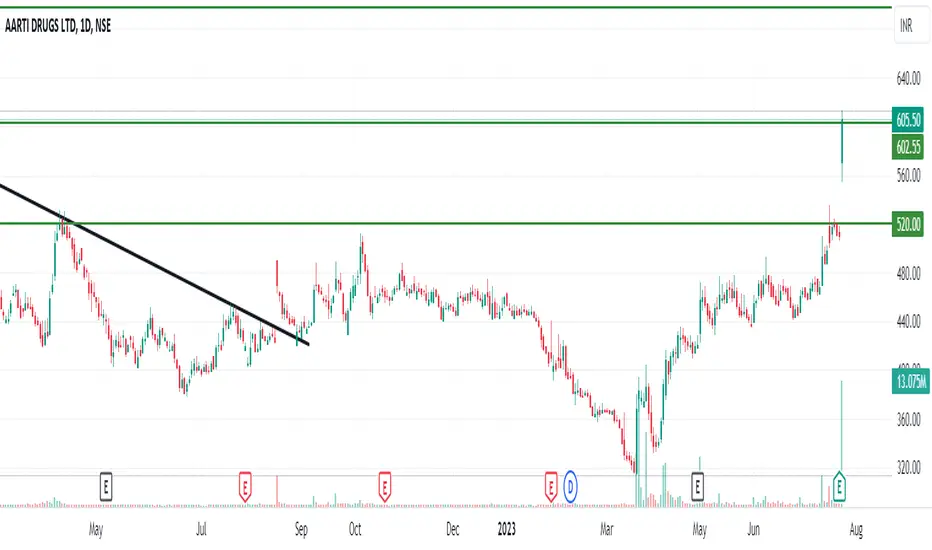
Aarti drugs Breakout Aarti drugs given daily chart Trendline Breakout then consolidation,now ready for Big move

Long AARTIDRUGSAarti Drugs is engaged in the manufacturing and marketing in active Pharmaceutical Ingredients , Pharma Intermediates and Specialty Chemicals. Having a pharma company always has its advantages now due to current ever increasing health issues. I expect a 10% move in the next 6 months.


Wave 3 in AARTIDRUGS can push price up by 80%!!The Stock witnessed a five-wave impulsive rise beginning in March 2023 and ending in July 2023.
The impulse move led to a 105% rally in the stock in a matter of just 5 months.
Since the completion of the wave 1 in July however, the stock went into the corrective wave 2 structure between July-October. The corrective phase can be marked as an Elliot wave Zig-zag(ABC) and led to a 50% retracement of the wave 1.
This phase ended in October and between October-November the stock displayed a slow moving leading diagonal as the first sign of reversal from the bottom of INR 444.This tiny diagonal is the only starting piece of the massive leg that is yet to unfold in the stock, taking it towards the INR 900 mark. The diagonal and its correction can be labeled as wave i&ii of 3 respectively and
now the stock has "jump-started" the wave iii of 3 on 18DEC with a +4.2% closing alongside uptick in volumes.
Upon successfully surpassing INR500 level, the stock shall be at the INR550 in 'very quick move'.
INR 900 is the projected target region for the Wave 3.
On the downside INR 470 can be used as 'SL'.
Note*- The views expressed are based on personal opinions and observations. Please do your own research before making any trading/investing decisions.

Easy Guess Comment Whats going to happen nextSo easy to predict whats going to happen next.
Forming the rounding bottom.

Resistance Breakout
Please look into the chart for a detailed understanding.
Consider these for short-term & swing trades with 2% profit.
For BTST trades consider booking
target for 1% - 2%
For long-term trades look out for resistance drawn above closing.
Please consider these ideas for educational purpose
AARTI DRUGS reday for breakout upside Aarti drugs making Inverter head & sholder pattern, if break out it this pattern than Target to upside 700 level & SL to be bellow 438.
Only for education purpose

Aarti DrugsShowing signs of reversal and crossing over of 5,20,50 SMA on monthly time frame shows positivity.
Safe entry would be above 515 where candle enters 1/1 damn angle and breaks out of the important Gann levels
