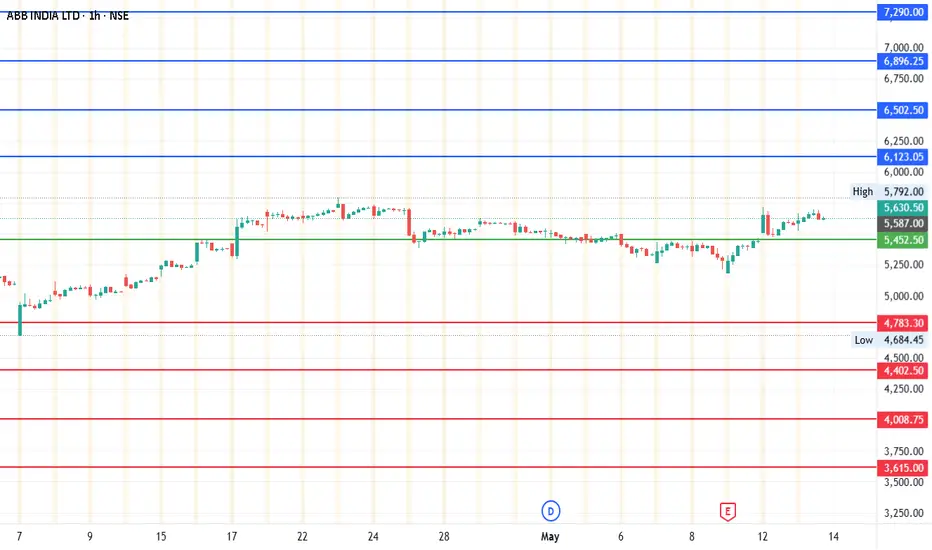
#ABB India | 1500-Point Move on the RadarAfter a strong breakout from the recent consolidation zone, ABB is showing renewed momentum with clear signs of accumulation and strength in trend.
We're now anticipating a fresh 1500-point move based on technical structure and price action dynamics.
Current Price: 5635
Mid-Point: 5452.50
Upside Targets: 6123.04, 6502.50, 6896.25 and7290.00
Downside Targets: 4783.28, 4402.50, 4008.75 and 3615.00
Support: 5164.05
Resistance: 5743.58
Disclaimer:
This analysis is for educational purposes only. Do your own due diligence before acting on any trade plan.
ABB trade ideas
Possible Swing Trade in ABB1. MACD Signal turned green
2. RSI crossing above 50
3. Stock returning after forming a base at 50.0% retracement
5. Good weekly close
6. Risk - Reward is more than 2
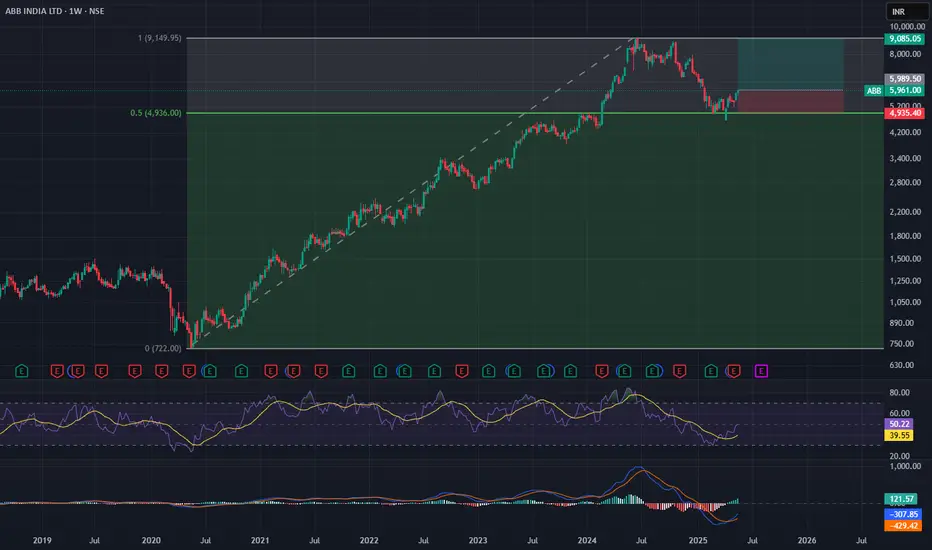
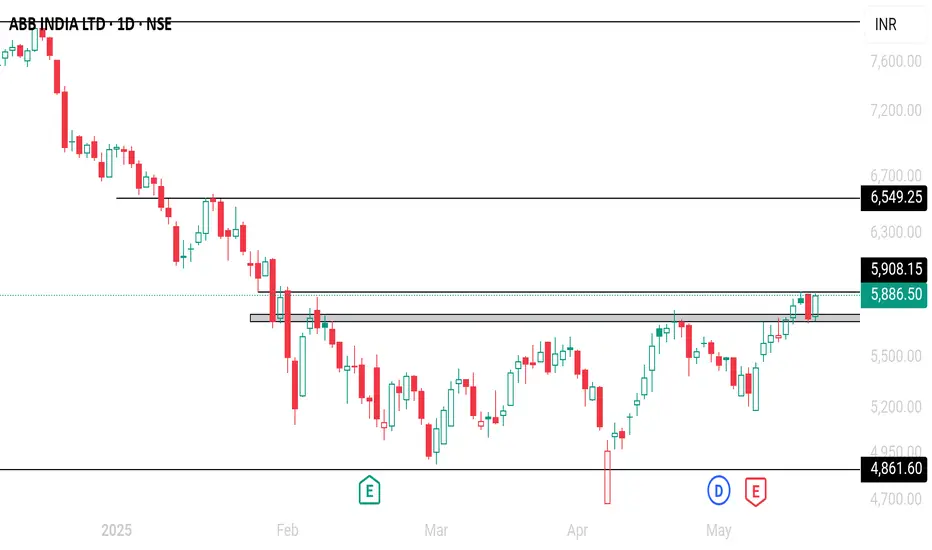
ABB India ???I Am little confused with my technical analysis on ABB India 1day time frame, need help,

Review and plan for 21st April 2025Nifty future and banknifty future analysis and intraday plan in kannada.
Quarterly results.
This video is for information/education purpose only. you are 100% responsible for any actions you take by reading/viewing this post.
please consult your financial advisor before taking any action.
----Vinaykumar hiremath, CMT

ABB India Ltd. (NSE: ABB) - Technical Analysis & Market OutlookABB India Ltd. (NSE: ABB) - Technical Analysis & Market Outlook
Overview:
ABB India Ltd. has demonstrated significant price action over the past few years, with a strong uptrend followed by a corrective phase. The current price action suggests a potential reversal from key support levels, presenting an opportunity for long-term investors and swing traders.
Key Observations:
Support Zone: The stock is currently testing a major support level around ₹5000 - ₹5200 , which aligns with a previous accumulation zone and historical resistance-turned-support.
200-Week Moving Average: Price action is hovering near the 200-week moving average, which has historically acted as a strong dynamic support.
RSI & Momentum: The Relative Strength Index (RSI) has moved into oversold territory and is now showing early signs of a potential reversal.
Volume Profile Analysis: The highest volume concentration is observed around the ₹6000-₹7000 range, indicating a major supply zone where price may retest if a reversal occurs.
Price Structure: The formation suggests a higher low structure , which is a positive sign for bullish continuation.
Potential Trade Setup:
Entry : Around the current levels of ₹5100-₹5200 with confirmation of bullish momentum.
Stop-Loss : Below ₹4800, as a break of this level may invalidate the bullish thesis.
Target 1 : ₹7000 (previous consolidation zone & high-volume area)
Target 2 : ₹9000 (previous swing high & psychological resistance)
Conclusion:
ABB India Ltd. is currently at a critical juncture, with strong confluence of technical factors supporting a potential upside move. Traders should monitor price action closely for confirmation before entering. If the support holds, the stock has a high probability of reversing towards higher levels.
Disclaimer: This analysis is for educational purposes only and should not be considered as financial advice. Conduct your own research before making any trading decisions.
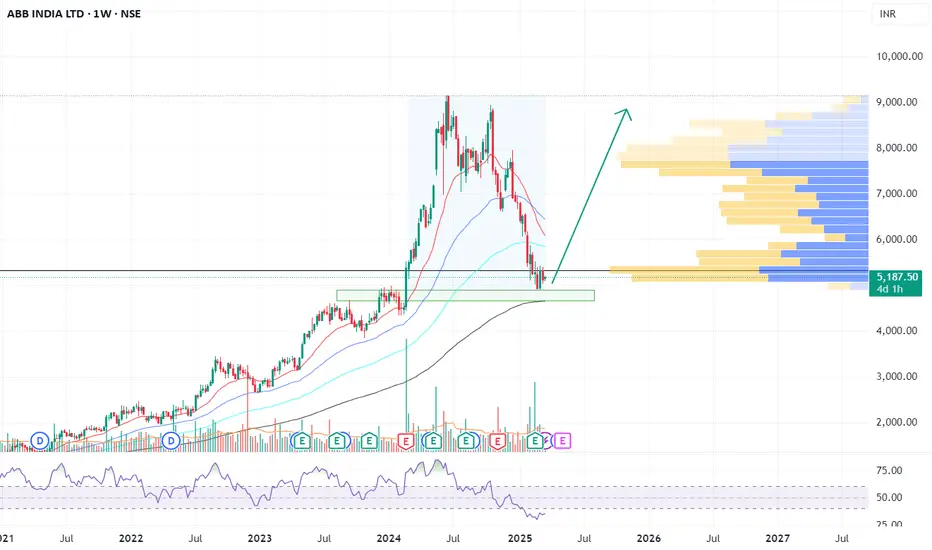
ABB - Short to mid-term analysis (NOT A BUY/SELL RECOMMEDATION)ABB is looking quite reasonable, and the chart indicates short-term bottom formation. Presently , a base for an upside would be 5112. If ABB crosses and sustains above 5112, then we can expect good upside upto 7116-7450+ . On the downside, risk is present if it breaches 4996. Upon breaching 4996, we can expect a downtrend up to the range of 4660-4045.

Review and plan for 19th February 2025 Nifty future and banknifty future analysis and intraday plan.
Result - action analysis.
This video is for information/education purpose only. you are 100% responsible for any actions you take by reading/viewing this post.
please consult your financial advisor before taking any action.
----Vinaykumar hiremath, CMT

ABB will have correction 30 - 35%?ABB has closed below 200 EMA on day time frame.
It has next demand support at 6600 & 6300.
Close below 6300 will confirm BAT pattern formation and this will lead to a correction up to 4400.
Target: 6600 / 6300 / 5500 / 5000 / 4400

ABB INDIA LTD S/R Support and Resistance Levels:
Support Levels: These are price points (green line/shade) where a downward trend may be halted due to a concentration of buying interest. Imagine them as a safety net where buyers step in, preventing further decline.
Resistance Levels: Conversely, resistance levels (red line/shade) are where upward trends might stall due to increased selling interest. They act like a ceiling where sellers come in to push prices down.
Breakouts:
Bullish Breakout: When the price moves above resistance, it often indicates strong buying interest and the potential for a continued uptrend. Traders may view this as a signal to buy or hold.
Bearish Breakout: When the price falls below support, it can signal strong selling interest and the potential for a continued downtrend. Traders might see this as a cue to sell or avoid buying.
MA Ribbon (EMA 20, EMA 50, EMA 100, EMA 200) :
Above EMA: If the stock price is above the EMA, it suggests a potential uptrend or bullish momentum.
Below EMA: If the stock price is below the EMA, it indicates a potential downtrend or bearish momentum.
Trendline: A trendline is a straight line drawn on a chart to represent the general direction of a data point set.
Uptrend Line: Drawn by connecting the lows in an upward trend. Indicates that the price is moving higher over time. Acts as a support level, where prices tend to bounce upward.
Downtrend Line: Drawn by connecting the highs in a downward trend. Indicates that the price is moving lower over time. It acts as a resistance level, where prices tend to drop.
Disclaimer:
I am not a SEBI registered. The information provided here is for learning purposes only and should not be interpreted as financial advice. Consider the broader market context and consult with a qualified financial advisor before making investment decisions.

ABB NSEABB has broken out of consolidation on Daily nad Weekly, Wait for Retest on DTF..and seek entry.

Review and plan for 5th November 2024 Nifty future and banknifty future analysis and intraday plan in kannada.
Resulst analysis.
This video is for information/education purpose only. you are 100% responsible for any actions you take by reading/viewing this post.
please consult your financial advisor before taking any action.
----Vinaykumar hiremath, CMT

ABB NSEABB after hitting a Peak of 9149 has corrected to @8000 levels, consolidating for @50days now it has broken out of the range, retested and moved upwards, Entry at current price with a 12%+ upside Estimated. Keep SL at 7350.

ABB Bullish BuyThe chart shows a strong upward trend in ABB India Ltd, with a recent consolidation forming a rising wedge pattern. This pattern typically indicates a potential breakout. The price is currently testing the upper boundary of the wedge, suggesting a possible bullish breakout if it surpasses the resistance level around 8,619.70 INR.
Key Levels:
Resistance: 8,972.10 INR
Support: 8,115.65 INR
Potential Trade Idea:
Bullish Scenario: A breakout above 8,619.70 INR could lead to a rally towards the next resistance at 8,972.10 INR.
Bearish Scenario: If the price fails to break out and falls below the wedge, watch for support at 8,115.65 INR.

ABB India Ltd - Potential Breakout Targeting ₹9,130This analysis focuses on ABB India Ltd , where the stock is exhibiting a potential breakout from its recent consolidation phase, suggesting an upward move toward ₹9,130, which is 9.39% higher from the current level. The chart includes Fibonacci retracement levels, key trendlines, and technical indicators.
Key Highlights:
Current Price : ₹8,510.30
Fibonacci Retracement:
61.8% retracement level around ₹8,835 has been broken, which is a bullish sign.
Price is expected to reach the 100% retracement level at ₹9,130.75, indicating further upside potential.
Trendline Breakout
: The stock has broken out of a descending triangle, confirming a breakout, which is supported by increasing volume and momentum.
Technical Indicators:
RSI: Shows a gradual rise, indicating growing bullish momentum.
Moving Averages: The stock is well above its 50-day and 200-day moving averages, reinforcing the bullish trend.
Key Levels to Watch:
Resistance: ₹9,130.75 (100% Fibonacci retracement).
Support : ₹8,084 (50% Fibonacci retracement).
Conclusion:
With the breakout above the descending triangle and the stock holding above key Fibonacci levels, ABB India Ltd appears set for an upside move toward ₹9,130 . Traders should watch for sustained volume and monitor support levels in case of pullbacks.

Abb looks good for buyAfter a pullback., consolodation and now ready for upmove
Buy above-8280.
Target-9000
Sl-780

ABB Bullish flag Buyhe chart illustrates a bullish flag pattern, characterized by a strong upward price movement (the flagpole) followed by a consolidation phase where the price trades within a narrow range, forming the flag. This pattern suggests a potential continuation of the upward trend.

ABB INDIA LTD S/R Support and Resistance Levels:
Support Levels: These are price points (green line/shade) where a downward trend may be halted due to a concentration of buying interest. Imagine them as a safety net where buyers step in, preventing further decline.
Resistance Levels: Conversely, resistance levels (red line/shade) are where upward trends might stall due to increased selling interest. They act like a ceiling where sellers come in to push prices down.
Breakouts:
Bullish Breakout: When the price moves above resistance, it often indicates strong buying interest and the potential for a continued uptrend. Traders may view this as a signal to buy or hold.
Bearish Breakout: When the price falls below support, it can signal strong selling interest and the potential for a continued downtrend. Traders might see this as a cue to sell or avoid buying.
20 EMA (Exponential Moving Average):
Above 20 EMA: If the stock price is above the 20 EMA, it suggests a potential uptrend or bullish momentum.
Below 20 EMA: If the stock price is below the 20 EMA, it indicates a potential downtrend or bearish momentum.
Trendline: A trendline is a straight line drawn on a chart to represent the general direction of a data point set.
Uptrend Line: Drawn by connecting the lows in an upward trend. Indicates that the price is moving higher over time. Acts as a support level, where prices tend to bounce upward.
Downtrend Line: Drawn by connecting the highs in a downward trend. Indicates that the price is moving lower over time. It acts as a resistance level, where prices tend to drop.
RSI: RSI readings greater than the 70 level are overbought territory, and RSI readings lower than the 30 level are considered oversold territory.
Combining RSI with Support and Resistance:
Support Level: This is a price level where a stock tends to find buying interest, preventing it from falling further. If RSI is showing an oversold condition (below 30) and the price is near or at a strong support level, it could be a good buy signal.
Resistance Level: This is a price level where a stock tends to find selling interest, preventing it from rising further. If RSI is showing an overbought condition (above 70) and the price is near or at a strong resistance level, it could be a signal to sell or short the asset.
Disclaimer:
I am not a SEBI registered. The information provided here is for learning purposes only and should not be interpreted as financial advice. Consider the broader market context and consult with a qualified financial advisor before making investment decisions.

"ABB" poised well for Long Side!"ABB" is a great counter to go Long on with high probability and great risk - reward ratio! The stock is about to breakout from a VCP (Volatility Contraction Pattern). The price has also closed near the breakout zone giving more confidence to enter the trade on Long Side.
#SniperTrade #Momentum #Options #CapitalMarkets #harshal95 #StockMarket

ABB upside target 8700 If ABB stock sees a breakout above 8006, then there is a possibility of good bullishness in the upcoming sessions, if seen, the stock has formed an uptrend channel in the month of August and the stock price is following this trend channel. If all the indicators, trend lines are studied properly, then the stock will see a good rise ahead. If the stock follows this channel, then the stock can also see targets up to 8750.

Abb ltdHigher highs higher lows
Pullback till 38.2% of current swing
Rsi hidden divergence n Avwap squeeze with volumes


ABB INDIA ABB INDIA is currently trading inside the zone, waiting for a breakout we can plan for trade after a successful breakout.
