AB Capital - Closed above all time high and consolidationAB Capital
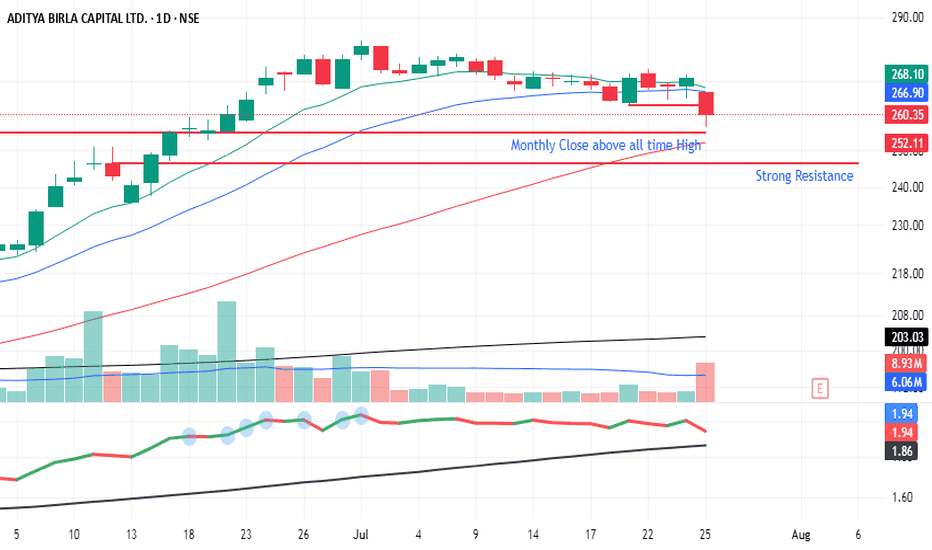
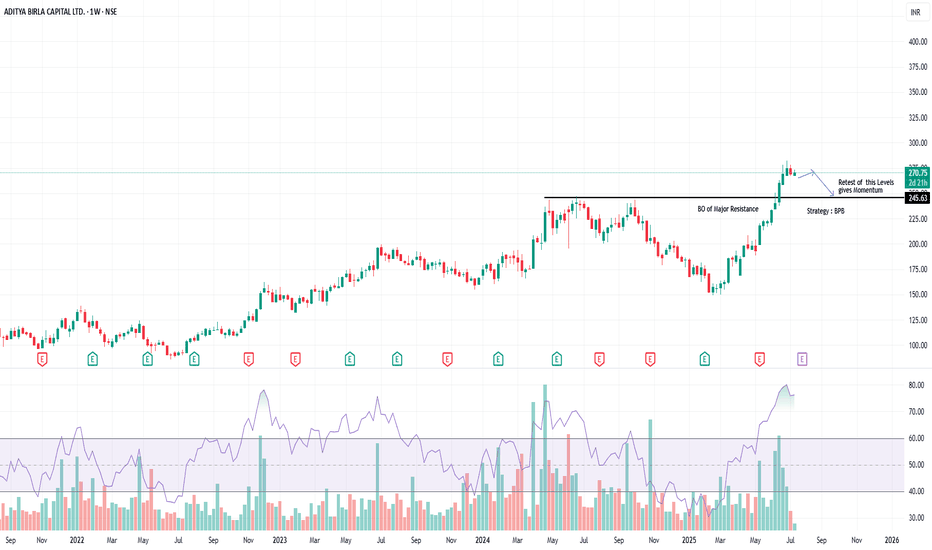
After closing above-time high of Rs. 255 in June 2025, the stock has entered a consolidation phase over the past month.
Key observations:
Support Zone: The 246-255 range is expected to provide strong support.
Trading Plan: Look for buying opportunities near the support zone (246-250) with a target of 280 and above.
A sustained move above 260 could lead to further upside.
This analysis is based on technical indicators and chart patterns. Always use proper risk management techniques and consider multiple perspectives before making trading decisions.
ABCAPITAL trade ideas
AB Capital – Clean Breakout of Multi-Year Resistance | BPB SetupTimeframe: Weekly | Strategy: Breakout–Pullback (BPB)
Technical Highlights:
========================
✅ BO (Breakout) of a major resistance zone around ₹250–₹255, which was acting as a multi-year supply zone.
📈 Strong bullish momentum seen with expanding volumes and wide-range candles.
🔄 BPB Strategy in Play: Price has broken out and now likely to retest the breakout zone.
🧠 Retest near ₹249–₹255 zone expected to provide fresh momentum.
📊 RSI confirms strength, currently above 70 – confirming a trending phase.
🔍 Key Zones:
===================
Breakout Level: ₹250 (Previous Resistance, now Support)
Immediate Resistance: ₹295–₹300
Target (Post BPB Confirmation): ₹330+
Support for Invalidating BPB: Weekly close below ₹245
📈 Trade Plan (for study purpose only):
=============================================
Wait for price to pull back into ₹250–₹255 zone.
Look for bullish candle confirmation on retest for entry.
SL: Below ₹245 | T1: ₹295 | T2: ₹330
⚠️ Disclaimer:
This idea is purely for educational purposes and does not constitute investment advice. Please consult your financial advisor before making any trading or investment decisions. Always do your own research and risk management.
ADITYA BIRLA CAPITAL LTD – Trend Reversal Breakout Trade🧠 Technical Highlights:
Downtrend Channel Breakout: Clear breakout from a falling channel pattern
Resistance Break: Strong breakout above supply zone of ₹204–₹210
Volume: Massive volume spike validates bullish strength
RSI: Above 70, indicating strong momentum but not overbought yet
🟢 Buy Setup
Buy Above: ₹219 (today's close confirms breakout)
Stoploss: ₹204 (below the previous resistance/new support)
Target 1: ₹235
Target 2: ₹248
Target 3: ₹260+ (swing/high-risk high-reward)
🔻 Sell/Short Setup (only if reversal)
Sell Below: ₹203
Stoploss: ₹210
Target: ₹190, ₹178
📅 Timeframe: Short-to-Medium Term (2–6 weeks)
📊 Risk-Reward: ~1:2.5
For Education Purposes Only
Analysis and Summary of the ADITYA BIRLA CAPITAL LTD. (NSE: ABCA🔍 Technical Overview:
Current Price: ₹200.25
Recent Price Action: Price is attempting a bounce after forming a higher low near ₹187.83.
📈 Key Technical Levels:
Fibonacci Levels:
0.0 (Support): ₹187.83
0.5 (Mid-Resistance): ₹204.67
0.618 (Golden Ratio): ₹208.64
1.0 (Previous High): ₹221.51
1.618 (Target Extension): ₹242.33
📐 Pattern Forming:
A descending triangle or falling wedge pattern seems to be forming, indicated by the downward sloping trendline from the recent highs. This setup can break out in either direction but often has a bullish bias when occurring in an uptrend.
📊 Interpretation:
Bullish View:
A break above ₹204.67 (0.5 Fibonacci level) could push prices toward ₹208.64, then ₹221.51.
If ₹221.51 breaks, ₹242.33 is the long-term Fibonacci extension target.
Bearish View:
A breakdown below ₹187.83 may trigger further correction.
This would invalidate the bullish setup.
🧠 Conclusion:
The stock is currently consolidating between key resistance at ₹204–208 and support at ₹187. A breakout above ₹208.64 will confirm bullish momentum. Watch for volume spikes and candlestick confirmation around those key levels.
The weekly chart of Aditya Birla Capital Ltd
The weekly chart of Aditya Birla Capital Ltd. (ABCAPITAL_1W) on the NSE showcases a significant trendline that has been acting as a robust support level. This trendline, drawn from the lows of late 2022 to mid-2023, has been a critical area where the price has oscillated multiple times, indicating its importance as a support zone.
Recently, the price approached this trendline, testing it multiple times with several candlesticks closing near or on this line. The last few weeks have seen the price bouncing off this support, with three consecutive green candles indicating a potential reversal or at least a pause in the downtrend. This series of green candles suggests renewed buying interest as investors might see this trendline as a buying opportunity.
Today, the price broke through this trendline, which could signal either a continuation of the downtrend if the price closes below this line or a false breakout if it quickly reverses back above it. Given the recent green candles and the historical significance of this trendline, there's a possibility that this could be a buying opportunity for those who believe in the stock's long-term potential.
Volume analysis shows a spike in trading activity around the time the price touched the trendline, which often indicates increased market interest and could precede a significant move. If the price sustains above this trendline, it might attract more buyers, potentially leading to an upward trend. Conversely, if it fails to hold above the line, it could see further declines.
Overall, the chart suggests that the trendline has been a critical level for ABCAPITAL, and its recent interaction with this line could be pivotal for short-term traders and long-term investors alike.
ABCAPITAL TECHNICAL VIEWThe chart shows a daily timeframe for **Aditya Birla Capital Ltd. (NSE)** with a notable **ABCD harmonic pattern**:
### **Key Technical Observations:**
1. **ABCD Pattern:**
- The chart depicts an ABCD bullish harmonic pattern, suggesting a potential reversal from point **D**.
- **Point B** marks a strong support level around **₹185-190**.
- The **potential target (D)** is around **₹230-235**, indicating a bullish price expectation.
2. **Fibonacci Levels:**
- The harmonic pattern is supported by Fibonacci retracements, with point **C** near a retracement level.
- **Point D** aligns with a Fibonacci extension level, further confirming the target zone.
3. **Support & Resistance:**
- **Support Levels**: Around **₹190**, followed by **₹175**.
- **Resistance Levels**: Around **₹202**, **₹230**, and **₹235**.
4. **Risk-Reward Ratio:**
- The stop-loss level appears near **₹175**, offering a favorable risk-to-reward ratio given the projected upside.
### **Conclusion:**
The stock seems to be in a bullish setup with a target near **₹230-235**. Traders may consider entering near the current price with a stop-loss around **₹175**, but they should monitor broader market conditions and any fundamental news that could impact the trend.
Aditya Birla Capital Ltd. (NSE: ABCAPITAL) Technical AnalysisCurrent Price: ₹201.60 (-0.82%)
Price Target (Jefferies): ₹265, maintained at Buy
Technical Overview
Price Action: The chart reflects a strong support level near ₹197-₹201, where the price is currently hovering. The support zone is reinforced by a trendline that has been respected several times (highlighted with green arrows). This support level aligns with a high-volume node in the volume profile, indicating considerable buying interest around this area.
Volume Profile Analysis: A significant amount of trading activity has occurred around the ₹190-₹200 range, suggesting strong demand. On the upside, high trading volume can also be seen around ₹227 and ₹241, which could act as resistance if the stock attempts an upward move.
Moving Averages: The 50-day and 200-day moving averages are providing additional support and resistance signals. The stock is currently trading near its 200-day moving average, which has historically provided solid support. A sustained break below this level could indicate bearish momentum.
Resistance Zones: The stock has encountered resistance around ₹240 (indicated by red arrows), with multiple attempts to break this level failing. This level will be crucial for the next bullish wave, and a breakout above it could lead to a new upward trend.
Key Pattern Observations: A broad ascending triangle pattern is observed, with the stock making higher lows since last year. This bullish structure indicates underlying strength, but a break below the support line could invalidate this pattern.
Technical Indicators
1.RSI: The Relative Strength Index is nearing the oversold territory, suggesting that the stock may be due for a reversal or consolidation phase.
2.Support and Resistance Levels:
Immediate Support : ₹197
Critical Support : ₹190
Resistance Levels: ₹211, ₹227, ₹241
Outlook and Conclusion
With Jefferies setting a revised target of ₹265 and maintaining a Buy rating, there is an optimistic long-term outlook. However, in the short term, the price may continue to consolidate around the ₹190-₹200 support region.
Bullish Scenario: If the stock bounces off the ₹197 level, supported by increased volume, it could make another attempt to reach ₹227 or even test the critical ₹240 resistance.
Bearish Scenario : A sustained break below ₹190 might attract further selling pressure, pushing the stock toward the ₹175 region.
Investment Idea: Traders may look for buy signals around the support zones of ₹190-₹200, with a potential target near ₹227 and ₹240, while maintaining a stop loss slightly below ₹190.
ABCapital Near its ATHOn monthly charts, stock has created inverted head and Shoulder pattern. Stock is consolidating near multiyear resistance and its all-time-high. short term target can be 260. If it sustains above 265, stock can show massive rally towards 450-500. But it will take time. Still, its good entry point if you can hold it for next 3 years.
Disclaimer : this is not stock suggestion. ideas are for educational purpose only.
volume is the key to momentum- ABCAPUnless a big player enters in stock - It is unlikely for stock to come in momentum for a longer period and when a biggie enter it is likely to stop on 5-10%
stock remains in momentum for many months sometimes many years.
HERE i have plotted 3 anchored vwap from point 1-2-3
now understand what does volume says -- it suggest someone who has much more money than an average retail/ who has much more information about business or say much more understanding about company wont bet for 5-10% or say trading...
They bet big
They bet size
your job is to catch momentum - now when will momentum come?
momentum will come when swing will break?
when will swing break - when all short term moving average breaks - all anchored vwap breaks all imp golden ratio breaks
now watch next chart for learning.
this chart is imp


