AB AMCCup and handle pattern, fundamentally strong. Cheap, if compared with HDFC AMC. Price level given. Lets see...
ABSLAMC trade ideas

ABSLAMC - Cup and Handle BreakoutWithin the FinServ space, this is a lagging stock, but because the sector has tailwinds, I am inclined to go behind it. Birla is a household name and such stocks do well over a long period of time.

Positional Setup for ABSLAMC (Aditya Birla Sun Life AMC)Positional Setup for ABSLAMC (Aditya Birla Sun Life AMC)
Current Price: ₹815.05
Resistance Levels: ₹860.05 → ₹901.40
Support Level: ₹786.20
Indicators: 5-9-20 EMA TEMA & Supertrend (Buy)
Breakout Observed: Strong upward move post consolidation
Volume Confirmation: Needed (check OBV or breakout candle volume)
📈 Technical View (Positional)
The stock has broken out of a resistance zone with strong momentum.
Currently trading above major EMAs and Supertrend in Buy mode.
If it sustains above ₹786–790, the next target zones are:
🎯 ₹860 (minor resistance)
🎯 ₹900–910 (major resistance zone / swing high)
Keep a positional SL below ₹760 for swing traders.

50 SMA Rising- Positional TradeDisclaimer: I am not a Sebi registered adviser.
This Idea is publish purely for educational purpose only before investing in any stocks please take advise from your financial adviser.
Its 50 SMA Rising Strategy. Suitable for Positional Trading Initial Stop loss lowest of last 2 candles and keep trailing with 50 days SMA if price close below 50 SMA then Exit or be in the trade some time trade can go for several months.
Be Discipline because discipline is the Key to Success in the STOCK Market.
Trade What you see not what you Think

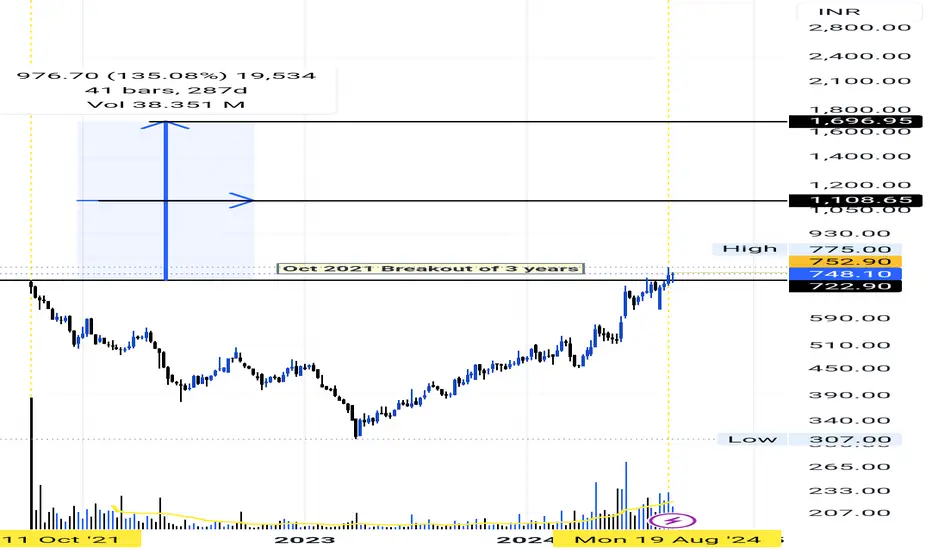
SWING TUTORIAL - ABSLAMCIn this tutorial, we analyze the stock NSE:ABSLAMC (Aditya Birla Sun Life AMC Limited) identifying a lucrative swing trading opportunity following its all-time high in Oct 2021. The stock declined by nearly 57%, forming a Lower Low Price Action Pattern, but subsequently reversed its trend.
At the same time, we can also observe the MACD Level making a contradictory Pattern of Higher Lows. This Higher Low Pattern of the MACD signaled the start of a Bullish Momentum, thereby also signaling a good Buying Opportunity.
The trading strategy yielded approximately 114% returns in 63 weeks. Technical analysis concepts used included price action analysis, MACD, momentum reversal, trend analysis and chart patterns. The MACD crossover served as the Entry Point, with the stock rising to its Swing High Levels of 720 and serving as our Exit too.
As of wiring this tutorial, we can also notice how the stock is making a breakout and retest of the Swing High levels and trying to continue its momentum further upward trying to make a new All Time High.
KEY OBSERVATIONS:
1. Momentum Reversal: The stock's price action shifted from a bearish to a bullish trend, indicating a potential reversal.
2. MACD Indicator: The Moving Average Convergence Divergence (MACD) line showed steady upward momentum, signaling increasing bullish pressure.
3. MACD Crossover: The successful crossover in May 2023 confirmed the bullish trend, creating an entry opportunity.
TRADING STRATEGY AND RESULTS:
1. Entry Point: MACD crossover in May 2023.
2. Exit Point: Swing High Levels - 720.
3. Return: Approximately 114%.
4. Trade Duration: 63 weeks.
TECHNICAL ANALYSIS CONCEPTS USED:
1. Price Action Analysis
2. MACD (Moving Average Convergence Divergence)
3. Momentum Reversal
4. Trend Analysis
5. Chart Patterns
NOTE: This case study demonstrates the effectiveness of combining technical indicators to identify bullish momentum. By recognizing Price Action, MACD movements, and Reversal patterns, traders can pinpoint potential entry and exit points.
Would you like to explore more technical analysis concepts or case studies? Share your feedback and suggestions in the comments section below.

ABSLAMC !! Perfect breakout and upside rally started !! ABSLAMC !! Perfect breakout and upside rally started !!
- Rounding bottom pattern breakout done
- Re-Test done
- Upside Rally started with heavy volume

ABSLAMC Breakout with Volumes !!NSE:ABSLAMC
Entry - 776.70
Targets - 15-20 percentage
SL - RS 21 NIFTY turns Negative
SL - Supertrend (10, 3) turns Negative

ADIT BIRL SUN LIF AMC LTD S/R Support and Resistance Levels:
Support Levels: These are price points (green line/shade) where a downward trend may be halted due to a concentration of buying interest. Imagine them as a safety net where buyers step in, preventing further decline.
Resistance Levels: Conversely, resistance levels (red line/shade) are where upward trends might stall due to increased selling interest. They act like a ceiling where sellers come in to push prices down.
Breakouts:
Bullish Breakout: When the price moves above resistance, it often indicates strong buying interest and the potential for a continued uptrend. Traders may view this as a signal to buy or hold.
Bearish Breakout: When the price falls below support, it can signal strong selling interest and the potential for a continued downtrend. Traders might see this as a cue to sell or avoid buying.
20 EMA (Exponential Moving Average):
Above 20 EMA(50 EMA): If the stock price is above the 20 EMA, it suggests a potential uptrend or bullish momentum.
Below 20 EMA: If the stock price is below the 20 EMA, it indicates a potential downtrend or bearish momentum.
Trendline: A trendline is a straight line drawn on a chart to represent the general direction of a data point set.
Uptrend Line: Drawn by connecting the lows in an upward trend. Indicates that the price is moving higher over time. Acts as a support level, where prices tend to bounce upward.
Downtrend Line: Drawn by connecting the highs in a downward trend. Indicates that the price is moving lower over time. It acts as a resistance level, where prices tend to drop.
RSI: RSI readings greater than the 70 level are overbought territory, and RSI readings lower than the 30 level are considered oversold territory.
Combining RSI with Support and Resistance:
Support Level: This is a price level where a stock tends to find buying interest, preventing it from falling further. If RSI is showing an oversold condition (below 30) and the price is near or at a strong support level, it could be a good buy signal.
Resistance Level: This is a price level where a stock tends to find selling interest, preventing it from rising further. If RSI is showing an overbought condition (above 70) and the price is near or at a strong resistance level, it could be a signal to sell or short the asset.
Disclaimer:
I am not a SEBI registered. The information provided here is for learning purposes only and should not be interpreted as financial advice. Consider the broader market context and consult with a qualified financial advisor before making investment decisions.

ADITYA BIRLA SUN LIFE AMC Formed CUP & Handle PatternAditya Birla sun life AMC Formed CUP & Handle Pattern on weekly chart .With a stoploss of 700 Target will be 825 ,1050 & final Target will be 1100
I am not Sebi registered analyst.
My studies are for educational purpose only.
Please Consult your financial advisor before trading or investing.

good quality stockAditya Birla Sun Life ltd
stock name, give one soild pramotore group company
Now, in India, mutual funds are sounding for retail investments
record-breaking fund inflow in mutual funds
AMC are now most trending investment media
listed price level breakout and sustain
look at chart and my study put on chart
comments for any questions on mind

ABSLAMC IPO strategy if any one knows IPO strategy then they don't required to explain about thre strategy
keep check my earlier IPO strategy chart analysis


Break Out + retest + fly... Educational purpose only. I am not sebi registered. No buy or sell recommendation.


Trade Idea in ABSLAMCHere we can see a swing Trade idea in NSE:ABSLAMC
BUY ABSLAMC
CMP 513
TP 568
SL 472
Aditya Birla Sun Life AMC Ltd. is an investment manager. Its business lines are Portfolio Management Services, Real Estate Investments, and Alternative Investment Funds. The Portfolio Management Service business line is a customized service designed to seek consistent long term results by adopting a research based, methodical approach to investing. The Real Estate Investment Advisory business line enables investors to access Real Estate Investments opportunities meant for investors on a private placement basis. The company was founded on September 5, 1994 and is headquartered in Mumbai, India.

Aditya AMC quarterly result tradeAditya Birla Sun Life AMC Ltd the company of the old and prestigious Birla group has posted its best ever quarterly result with highest sales and net profit. The quarterly has profit has increased to 209 crore and its growth is supported by the accelerated growth of whole mutual fund industry. The target price is 700 for about 47% potential gain
It is a high potential company because of the following factors-
Return on capital employed >30
Debt to equity <0.1
Net profit preceding 12months >500
Net Profit latest quarter >100
Please do your own analysis before investing or trading.
Thank you and do like and follow if you like my analysis.

stage 1 brake out the stock broke 3 weeks back later week pulled back to the support range and came back strongly with decent volume. the stock is fundamentally good and the recent increase in SIP amount shows that an increase in investor's participate will help the stock further.

ABSLAMCThese are swing ideas which you can add your watchlist and analysis for yourself !
Keep on your radar!
This I am not sebi ragister I

ABSLAMC SWING TRADE IDEAABSLAMC very much near to break its long time weekly resistance zone trend vis positive side can play this for swing trade abv weekly resistance zone with your prefered RR.

ADITYA BIRLA **(FRESH BREAK OUT)Double bottom confirmed in this stock supported by pretty gud volume. Rsi above 60.
sl 388. first target SHOWN

Next HDFC AMCThis is my opinion please consider your due diligence before investing.
This is an analysis of technical or financial , Understanding of business

