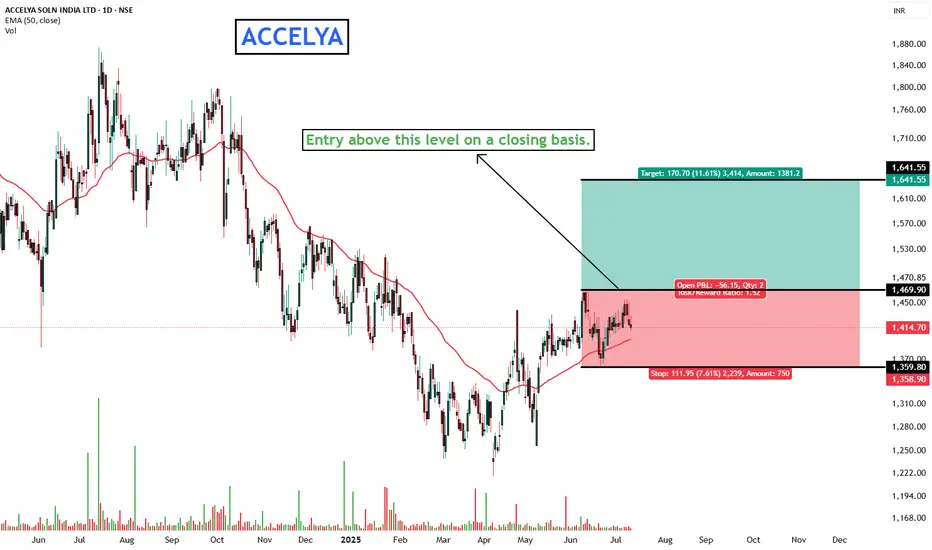
ACCELYA - SWING TRADE OPPORTUNITY WITH 1:1.5 RREverything is pretty much explained in the picture itself.
I am Abhishek Srivastava | SEBI-Certified Research and Equity Derivative Analyst from Delhi with 4+ years of experience.
I focus on simplifying equity markets through technical analysis. On Trading View, I share easy-to-understand insights
Next report date
—
Report period
—
EPS estimate
—
Revenue estimate
—
86.45 INR
1.29 B INR
5.29 B INR
3.71 M
About ACCELYA SOLN INDIA LTD
Sector
Industry
CEO
Gurudas Shenoy
Website
Headquarters
Pune
Founded
1976
ISIN
INE793A01012
FIGI
BBG000C278N1
Accelya Solutions India Ltd. engages in the provision of business process outsourcing; software application hosting and support; and software license and maintenance services. It operates through the following geographical segments: Asia Pacific; Middle East and Africa; Americas; and Europe. The Asia Pacific segment includes India, Afghanistan, Australia, Bangladesh, China, Fiji, Hong Kong, Indonesia, Japan, Malaysia, Maldives, New Zealand, Philippines, Seychelles, Singapore, South Korea, Sri Lanka, Sultanate of Brunei, Taiwan, Thailand, and Vietnam. The Middle East and Africa segment is involved in Bahrain, Casablanca, Kenya, Kuwait, Lebanon, Namibia, Rwanda, Saudi Arabia, Tanzania, and UAE. The Americas segment focuses on Argentina, Brazil, Canada, Chile, Colombia, Colorado, Mexico, and USA. The Europe segment comprises of France, Germany, Greece, Italy, Luxembourg, Malta, Poland, Portugal, Spain, Turkey, and UK. The company was founded by Vipul Jinendra Prashad Jain and Narendra Kumar Harihar Kale in 1976 and is headquartered in Pune, India.
Related stocks
Accelya Kale Solutions-Nice BreakoutAccelya Kale Solutions-Nice Breakout
Capital to be deployed -20k
Investing Price-1800-1810
Breakout Price -1792
Stoploss -1604
Targets -2300-3056
#StockMarketindia #StockToWatch #StocksInFocus #stockstowatch #StocksToTrade #accelya

Cup Pattern 6 Year Range BreakoutCup patter made in 6 year range, after consolidation monthly TF strong breakout done.

Accelya riding with IT themeAccelya trading above 20 EMA
Just need a day close above 1411.
Fundamentally trading at at 17x PE, and have very less subscribed shares.
so the share will be in demand.
for short term, it can travel 5-10 % and in long run we can also see 1900 levels

Accelya solution weekly cup and handle pattern breakout Accelya solution weekly cup and handle pattern breakout
Bulk deal-Plutus wealth management LLP Bought 74711 shares at 1709.99
Swing target-2005,2418 and 2835.
Accurate trading

Accelya Solutions Daily timeframe analysis for long term
NSE:ACCELYA has grabbed 6 month demand zone support level liquidity 1336 range.
We can see long term move above 1389 with SL of 1310 and can average till 1339.
Major targets levels are highlighted in blue lines.

Accelya Solutions is a high dividend paying IT co.Accelya Solution Ltd. CMP – 1390.55
Market Capitalization Rs 2,075.6Cr
Red Flags:🟥
MFs are decreasing stake
Green Flags:🟩
No debt
Zero promoter pledge
FIIs are increasing stake
Improving annual net profit
Improving cash from operations annual
Dividend Yield @CMP = 4.67%
Previous Happy Candles Nu

VCP breakout!!Stock has given a strong breakout from VCP or ascending triangle. It is heading towards 1700 zone as it was a previous swing high where aggressive selling had started and also a gap which will act as a resistance.

Accelya solutionsGood stock catering to airlines entertainment/support
IT stock
Decent PE, High ROE,ROCE
Accumulate for long term.

Accelya SolutionsA stunning arrangement is developing weekly, backed by a bullish 1/1 angle and in close proximity to one of the Gann box levels and angular resistance.
The upcoming Monday holds significance as the Gann date for this particular script, and all these elements align favorably, indicating a potential

See all ideas
Summarizing what the indicators are suggesting.
Oscillators
Neutral
SellBuy
Strong sellStrong buy
Strong sellSellNeutralBuyStrong buy
Oscillators
Neutral
SellBuy
Strong sellStrong buy
Strong sellSellNeutralBuyStrong buy
Summary
Neutral
SellBuy
Strong sellStrong buy
Strong sellSellNeutralBuyStrong buy
Summary
Neutral
SellBuy
Strong sellStrong buy
Strong sellSellNeutralBuyStrong buy
Summary
Neutral
SellBuy
Strong sellStrong buy
Strong sellSellNeutralBuyStrong buy
Moving Averages
Neutral
SellBuy
Strong sellStrong buy
Strong sellSellNeutralBuyStrong buy
Moving Averages
Neutral
SellBuy
Strong sellStrong buy
Strong sellSellNeutralBuyStrong buy
Displays a symbol's price movements over previous years to identify recurring trends.
Frequently Asked Questions
The current price of ACCELYA is 1,395.90 INR — it has increased by 0.74% in the past 24 hours. Watch ACCELYA SOLN INDIA LTD stock price performance more closely on the chart.
Depending on the exchange, the stock ticker may vary. For instance, on NSE exchange ACCELYA SOLN INDIA LTD stocks are traded under the ticker ACCELYA.
ACCELYA stock has fallen by −1.72% compared to the previous week, the month change is a −1.77% fall, over the last year ACCELYA SOLN INDIA LTD has showed a −22.98% decrease.
ACCELYA reached its all-time high on Feb 15, 2024 with the price of 2,127.40 INR, and its all-time low was 16.35 INR and was reached on Nov 21, 2008. View more price dynamics on ACCELYA chart.
See other stocks reaching their highest and lowest prices.
See other stocks reaching their highest and lowest prices.
ACCELYA stock is 4.27% volatile and has beta coefficient of 0.94. Track ACCELYA SOLN INDIA LTD stock price on the chart and check out the list of the most volatile stocks — is ACCELYA SOLN INDIA LTD there?
Today ACCELYA SOLN INDIA LTD has the market capitalization of 20.83 B, it has decreased by −0.24% over the last week.
Yes, you can track ACCELYA SOLN INDIA LTD financials in yearly and quarterly reports right on TradingView.
ACCELYA SOLN INDIA LTD is going to release the next earnings report on Oct 15, 2025. Keep track of upcoming events with our Earnings Calendar.
ACCELYA net income for the last quarter is 339.45 M INR, while the quarter before that showed 302.45 M INR of net income which accounts for 12.23% change. Track more ACCELYA SOLN INDIA LTD financial stats to get the full picture.
EBITDA measures a company's operating performance, its growth signifies an improvement in the efficiency of a company. ACCELYA SOLN INDIA LTD EBITDA is 1.94 B INR, and current EBITDA margin is 36.77%. See more stats in ACCELYA SOLN INDIA LTD financial statements.
Like other stocks, ACCELYA shares are traded on stock exchanges, e.g. Nasdaq, Nyse, Euronext, and the easiest way to buy them is through an online stock broker. To do this, you need to open an account and follow a broker's procedures, then start trading. You can trade ACCELYA SOLN INDIA LTD stock right from TradingView charts — choose your broker and connect to your account.
Investing in stocks requires a comprehensive research: you should carefully study all the available data, e.g. company's financials, related news, and its technical analysis. So ACCELYA SOLN INDIA LTD technincal analysis shows the sell today, and its 1 week rating is neutral. Since market conditions are prone to changes, it's worth looking a bit further into the future — according to the 1 month rating ACCELYA SOLN INDIA LTD stock shows the neutral signal. See more of ACCELYA SOLN INDIA LTD technicals for a more comprehensive analysis.
If you're still not sure, try looking for inspiration in our curated watchlists.
If you're still not sure, try looking for inspiration in our curated watchlists.