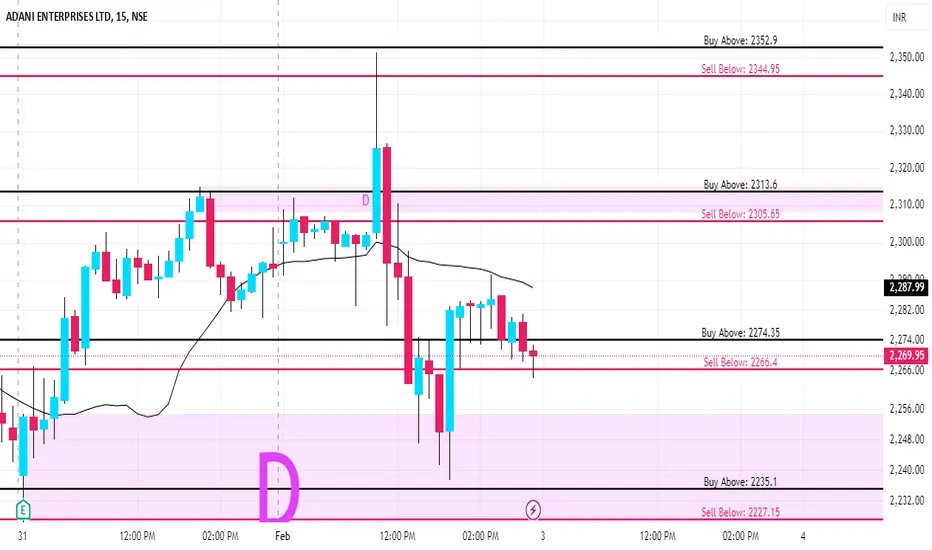
ADANIENT KEY LEVELS FOR 03/02/2025**Explanation:**
This trading system helps you avoid blind trades by providing confirmation for better entries and exits.
**Entry/Exit Points:**
- **Entry/Exit Lines:** Use the BLACK line for long trades and the RED line for short trades, based on confirmation from your trading plan.
- **Stop Loss:** For long trades, set the stop loss at the RED line below. For short trades, set it at the BLACK line above.
- **Take Profit:** For long trades, target the next RED line above. For short trades, target the next BLACK line below.
**Timeframe:**
Use a 5 mins timeframe for trading.
**Risk Disclaimer:**
This setup is for educational purposes. I'm not responsible for your gains or losses. Check the chart for more details.
ADANIENT trade ideas
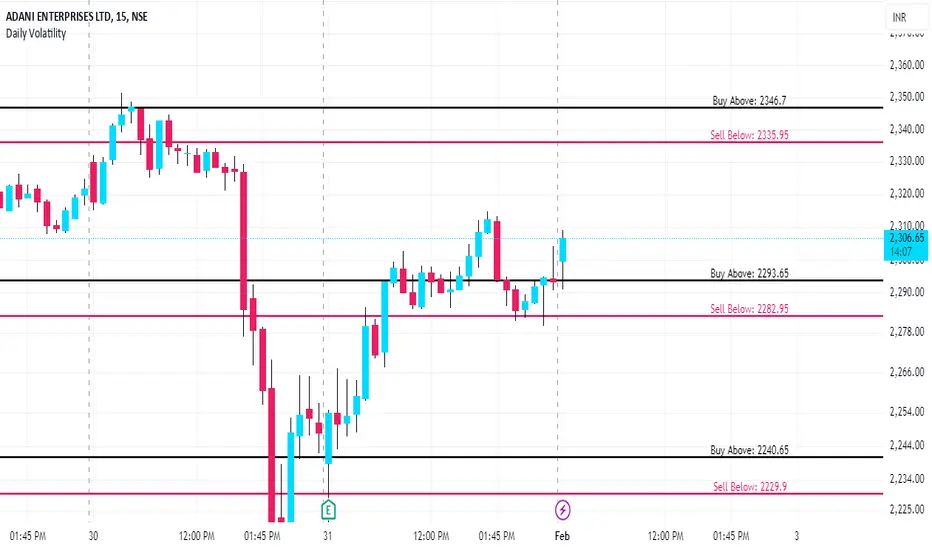
ADANIENT KEY LEVELS FOR 01/02/2025**Explanation:**
This trading system helps you avoid blind trades by providing confirmation for better entries and exits.
**Entry/Exit Points:**
- **Entry/Exit Lines:** Use the BLACK line for long trades and the RED line for short trades, based on confirmation from your trading plan.
- **Stop Loss:** For long trades, set the stop loss at the RED line below. For short trades, set it at the BLACK line above.
- **Take Profit:** For long trades, target the next RED line above. For short trades, target the next BLACK line below.
**Timeframe:**
Use a 5 mins timeframe for trading.
**Risk Disclaimer:**
This setup is for educational purposes. I'm not responsible for your gains or losses. Check the chart for more details.
ADANIENT KEY LEVELS FOR 31/01/2025**Explanation:**
This trading system helps you avoid blind trades by providing confirmation for better entries and exits.
**Entry/Exit Points:**
- **Entry/Exit Lines:** Use the BLACK line for long trades and the RED line for short trades, based on confirmation from your trading plan.
- **Stop Loss:** For long trades, set the stop loss at the RED line below. For short trades, set it at the BLACK line above.
- **Take Profit:** For long trades, target the next RED line above. For short trades, target the next BLACK line below.
**Timeframe:**
Use a 5 mins timeframe for trading.
**Risk Disclaimer:**
This setup is for educational purposes. I'm not responsible for your gains or losses. Check the chart for more details.

ADANIENT KEY LEVELS FOR 30/01/2025**Explanation:**
This trading system helps you avoid blind trades by providing confirmation for better entries and exits.
**Entry/Exit Points:**
- **Entry/Exit Lines:** Use the BLACK line for long trades and the RED line for short trades, based on confirmation from your trading plan.
- **Stop Loss:** For long trades, set the stop loss at the RED line below. For short trades, set it at the BLACK line above.
- **Take Profit:** For long trades, target the next RED line above. For short trades, target the next BLACK line below.
**Timeframe:**
Use a 5 timeframe for trading.
**Risk Disclaimer:**
This setup is for educational purposes. I'm not responsible for your gains or losses. Check the chart for more details.

ADANIENT KEY LEVELS FOR 27/01/2025**Explanation:**
This trading system helps you avoid blind trades by providing confirmation for better entries and exits.
**Entry/Exit Points:**
- **Entry/Exit Lines:** Use the BLACK line for long trades and the RED line for short trades, based on confirmation from your trading plan.
- **Stop Loss:** For long trades, set the stop loss at the RED line below. For short trades, set it at the BLACK line above.
- **Take Profit:** For long trades, target the next RED line above. For short trades, target the next BLACK line below.
**Timeframe:**
Use a 5 timeframe for trading.
**Risk Disclaimer:**
This setup is for educational purposes. I'm not responsible for your gains or losses. Check the chart for more details.

ADANIENT KEY LEVELS FOR 24/01/2025**Explanation:**
This trading system helps you avoid blind trades by providing confirmation for better entries and exits.
**Entry/Exit Points:**
- **Entry/Exit Lines:** Use the BLACK line for long trades and the RED line for short trades, based on confirmation from your trading plan.
- **Stop Loss:** For long trades, set the stop loss at the RED line below. For short trades, set it at the BLACK line above.
- **Take Profit:** For long trades, target the next RED line above. For short trades, target the next BLACK line below.
**Timeframe:**
Use a 5 timeframe for trading.
**Risk Disclaimer:**
This setup is for educational purposes. I'm not responsible for your gains or losses. Check the chart for more details.

ADANIENT KEY LEVELS FOR 23/01/2025**Explanation:**
This trading system helps you avoid blind trades by providing confirmation for better entries and exits.
**Entry/Exit Points:**
- **Entry/Exit Lines:** Use the BLACK line for long trades and the RED line for short trades, based on confirmation from your trading plan.
- **Stop Loss:** For long trades, set the stop loss at the RED line below. For short trades, set it at the BLACK line above.
- **Take Profit:** For long trades, target the next RED line above. For short trades, target the next BLACK line below.
**Timeframe:**
Use a 5 timeframe for trading.
**Risk Disclaimer:**
This setup is for educational purposes. I'm not responsible for your gains or losses. Check the chart for more details.

ADANIENT Key levels for 21/01/2025**Explanation:**
This trading system helps you avoid blind trades by providing confirmation for better entries and exits.
**Entry/Exit Points:**
- **Entry/Exit Lines:** Use the BLACK line for long trades and the RED line for short trades, based on confirmation from your trading plan.
- **Stop Loss:** For long trades, set the stop loss at the RED line below. For short trades, set it at the BLACK line above.
- **Take Profit:** For long trades, target the next RED line above. For short trades, target the next BLACK line below.
**Timeframe:**
Use a 5 timeframe for trading.
**Risk Disclaimer:**
This setup is for educational purposes. I'm not responsible for your gains or losses. Check the chart for more details.

Adani Enterprise Is it going to Make it BIG/BAD??????Adani Enterprises Limited (AEL) has demonstrated notable financial performance recently. In the quarter ending September 30, 2024, the company reported a consolidated net profit of ₹1,742 crore, marking a substantial increase from ₹228 crore in the same period the previous year. This growth is attributed to strong earnings from its airports and new energy units, which offset declines in the coal trading sector.
Additionally, AEL has been expanding its operations. The company commenced operations at its copper smelter in Mundra, Gujarat, aiming to reduce India's reliance on refined copper imports. The smelter is expected to reach its full capacity of 500,000 metric tons by February-March 2025, with plans to scale up to 1 million tons by 2028-29.
Value
1)The intrinsic value of one ADANIENT stock under the base case scenario is 2 969.596 INR. Compared to the current market price of 2 399.8999 INR, Adani Enterprises Ltd is undervalued by 19%.
2) The Relative Value of one ADANIENT stock under the base case scenario is 4 832.4164 INR. Compared to the current market price of 2 399.8999 INR, Adani Enterprises Ltd is undervalued by 50%.
3)According to Wall Street analysts, the average 1-year price target for ADANIENT is 4 340.1 INR with a low forecast of 3 838 INR and a high forecast of 4 945.5 INR.
Relative Value is the estimated value of a stock based on various valuation multiples like P/E and EV/EBIT ratios. It offers a quick snapshot of a stock's valuation in relation to its peers and historical norms.
Revenue and Profitability:
1)Revenue: In the fiscal year 2023-24 (FY24), AEL reported a revenue from operations of ₹96,421 crore, a 24.3% decrease from ₹127,540 crore in FY23.
2)EBITDA: Despite the revenue decline, EBITDA increased by 32% to ₹13,237 crore in FY24, up from ₹10,012 crore in FY23.
3)Net Profit: The net profit for FY24 rose by 39.6% to ₹3,955 crore, compared to ₹2,833 crore in the previous fiscal year.
Quarterly Performance (Q2 FY25):
For the quarter ending September 30, 2024, AEL's net profit surged to ₹1,742 crore, a significant increase from ₹228 crore in the same period the previous year.
Balance Sheet Highlights:
1)Assets: Total assets increased by 13.7% to ₹1,606 billion in FY24, up from ₹1,413 billion in FY23.
2)Liabilities: Total liabilities grew by 13.7% to ₹1,606 billion in FY24, with long-term debt rising by 42.2% to ₹463 billion.
3)Debt-to-Equity Ratio: The debt-to-equity ratio increased to 0.34 times in FY24 from 0.21 times in FY23, indicating higher leverage.
Cash Flow:
1)Operating Activities: Cash flow from operating activities stood at ₹103 billion in FY24.
Investing Activities: Cash outflow from investing activities was ₹191 billion in FY24, reflecting ongoing capital expenditures.
2)Financing Activities: Cash flow from financing activities improved significantly to ₹89 billion in FY24.
Operational Highlights:
The company's growth was driven by its airport operations and green energy business, with the new energy segment's pre-tax profits doubling to ₹9.41 billion, now comprising 39% of the overall profit.
Following the announcement of Hindenburg's disbandment, shares of Adani Group companies experienced a surge. For instance, Adani Enterprises' stock rose by 7.7%, reaching ₹2,569.85, and Adani Power's shares jumped 9% to ₹599.90 on the BSE.

Vwap initial balance break ready for imbalance
• Understanding VWAP – The theory behind VWAP and why it’s essential in trading.
• Calculating VWAP – Step-by-step breakdown of VWAP calculation.
• VWAP as Support & Resistance – How to use VWAP levels to improve trade execution.
• Intraday VWAP Trading Strategies – Techniques for scalping, momentum trading, and
• Multi-Day VWAP Analysis – How to use anchored VWAP and rolling VWAP.
• VWAP in Different Markets – Application in stocks, forex, crypto, and futures trading.
• Fakeouts & Reversals – Avoiding common VWAP traps.
• Institutional Order Flow & VWAP – Understanding how big players use VWAP.
• Combining VWAP with Other Indicators – Enhancing trading strategies with moving averages, RSI, MACD, and Bollinger Bands.

Adani Enterprises and a curved cosolidatio zone Hi, trying to show a curved consolidation zone formed by the stock since hindenburg event, stock is now in a LL pattern trying to take support at the below tl but a LL one , also nearing HH tl , lets c how it unfolds, will share my 12M, monthly and weekly levels in the below graphics, also the monthly, and smaller time frames patterns , hope u will like it.
I will try to explain the date choice's made by hindenburg using technical analysis also

Adani enterprise target 2000adani enterprise elliot wave analysis daily time period price move upside corrective wave and breakdown

Adani Enterprise 23rd DecemberResistance (Upside Levels):
2415.25
2404.90
2390.75
Support (Downside Levels):
2348.95
2329.40

Adani Enterprise 23rd DecemberResistance (Upside Levels):
2415.25
2404.90
2390.75
Support (Downside Levels):
2348.95
2329.40

Adani enterprise Survey this year, but need miracleIf you current data, it seem like not enough positive trade on this amount in past history. Also India BJP Government sideline the Adani, as focus is only thing for government left is on "One Nation, One Election" to survive BJP Government with many problem without solution. See Adani Test Timeline for references.
- Trump first day 1/21/2025
- India Budget Session ~2/1/2025 to 5/30/2025 (Possible More funding for Adani)
- 2 Month till Feb 2025 = ~.005 loss, Adani survive as goal not to reach under ~$2100.
- 2 Month till Feb 2025 = VP or Amitshah removal amendment in India Govement pass, Adani stock speed down to loss very fast and India collapse. Orelse Adani survive.
- 3 Month till March 2025 = US Budget bill day, US may everthing get halted, Adani survive for that month.
- 4 Month till April 2025 = If Trump cabinate choices get approved, No India Amendment for removal, US doesn't hault, then Adani Final Showdown Lawsuite Begin.

ADANI ENTERPRISE Swing TradeHello,
Trend-Based Analysis. Buy the Dips, Sell The Rallies, Also Following the Trend. Let's see where the Price Action takes us, Riding the wave. Potential trade setups based on trend momentum.
Technical analysis based on trend identification and momentum, Looking for high-probability setups within the prevailing trend.
Analyzing the current market trend and potential future price movement. Focusing on risk management and reward-to-risk ratios.
Details is Mentioned in Chart, Read carefully.. .

ADANIENT KEY LEVELS FOR 12/12/2024//@description
// All credit goes to Tony for the concept of this indicator. His Trading View link: www.tradingview.com
// Note: The calculation method in this indicator differs from Tony's, but the concept is derived from his work.
**Explanation:**
This trading system helps you avoid blind trades by providing confirmation for better entries and exits. It considers volume, past prices, price range and indiavix.
**Entry/Exit Points:**
- **Entry/Exit Lines:** Use the BLACK line for long trades and the RED line for short trades, based on confirmation from your trading plan.
- **Stop Loss:** For long trades, set the stop loss at the RED line below. For short trades, set it at the BLACK line above.
- **Take Profit:** For long trades, target the next RED line above. For short trades, target the next BLACK line below.
**Timeframe:**
Use a 5 timeframe for trading.
**Risk Disclaimer:**
This setup is for educational purposes. I'm not responsible for your gains or losses. Check the chart for more details.

ADANIENT // What to do?www.tradingview.com
ADANIENT: Everyone should have a partner like ADANI...the GQG Partners :). Whenever Adani stocks are in trouble, they come as savior.
Jokes apart, here are the findings. The lower gaps are filled now.
The upper gaps are still open so there are chances it may go to fill them.
The Resistances are 2420 / 2544 / 2667 / 2755
The Support are 2020 / 1763 / 1500
I would prefer to enter for a buy position once it breaks and sustains above 2420 atleast and target will be 2750 for short term. The most safe or stable buy can be above 2900.

Adanien 27 Nov 2024 Bullish zone is above 2192
Bearish zone is below 2110
Note: This is not a buy/sell call. Use stop loss whenever trade.

Adnani Accusations only comes after corrections.Adnani Enterprise may sustain this bad time, but it will be last time in history of enterprise. Unless Goverment comes to save, wait and watch..

Can a Corporate Titan Withstand the Tremors of Allegations?In the high-stakes arena of global business, few narratives captivate the imagination quite like the meteoric rise and sudden turbulence of an economic powerhouse. The Adani Group once celebrated as a paragon of Indian entrepreneurial success, now finds itself navigating treacherous waters of legal scrutiny and market skepticism. What began as a remarkable journey of a diamond trader turned infrastructure magnate has transformed into a complex tale of ambition, power, and potential corporate misconduct that challenges our understanding of success in the modern economic landscape.
The allegations against Gautam Adani—ranging from securities fraud to a purported massive bribery scheme—represent more than just a corporate challenge; they symbolize a pivotal moment of reckoning for corporate governance in emerging markets. With U.S. prosecutors indicting Adani and a damaging report by Hindenburg Research accusing the group of "the largest con in corporate history," the conglomerate has witnessed a staggering $68 billion evaporation of market value. This precipitous fall from grace serves as a stark reminder that even the most seemingly invincible corporate empires can be vulnerable to the harsh light of forensic scrutiny and legal investigation.
The unfolding saga transcends the individual narrative of Gautam Adani, touching upon broader themes of economic development, political connections, and the delicate balance between entrepreneurial ambition and ethical conduct. As the Adani Group confronts these unprecedented challenges, the world watches with bated breath, understanding that the outcome will not merely determine the fate of one business empire, but potentially reshape perceptions of India's economic credibility on the global stage. The resilience, transparency, and response of the Adani Group in the face of these allegations will serve as a critical case study in corporate accountability and the complex interplay between business, politics, and regulatory oversight.
Ultimately, this narrative invites us to reflect on the fundamental principles of corporate integrity and the thin line between visionary entrepreneurship and potential systemic manipulation. As investors, policymakers, and global observers, we are compelled to ask: Can reputation, built over decades, withstand the seismic tremors of serious allegations? The Adani Group's journey offers a compelling, real-time exploration of this profound question, challenging our assumptions about success, power, and the intricate mechanisms that govern global business ecosystems.

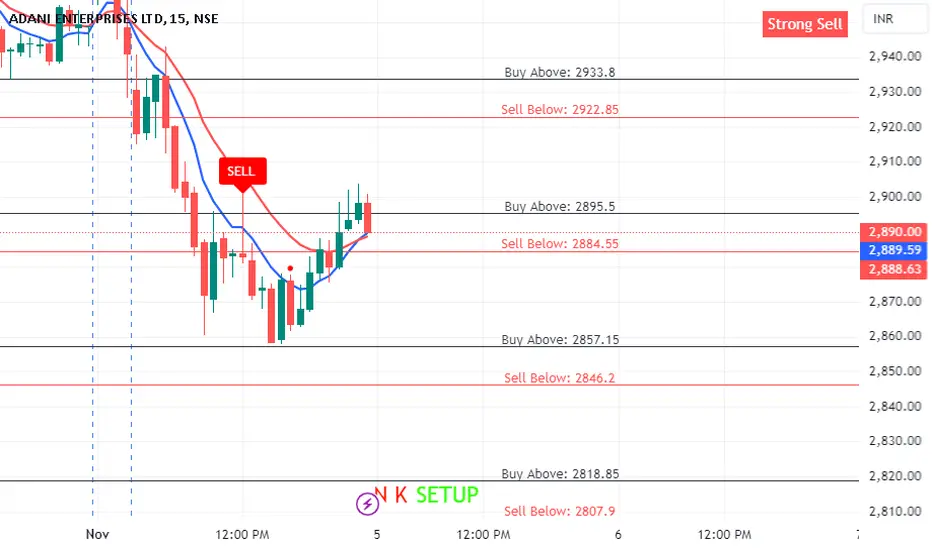
ADANIENT KEY LEVELS FOR 05/11/2024//@description
// All credit goes to Tony for the concept of this indicator. His Trading View link: www.tradingview.com
// Note: The calculation method in this indicator differs from Tony's, but the concept is derived from his work.
**Explanation:**
This trading system helps you avoid blind trades by providing confirmation for better entries and exits. It considers volume, past prices, price range and indiavix.
**Entry/Exit Points:**
- **Entry/Exit Lines:** Use the BLACK line for long trades and the RED line for short trades, based on confirmation from your trading plan.
- **Stop Loss:** For long trades, set the stop loss at the RED line below. For short trades, set it at the BLACK line above.
- **Take Profit:** For long trades, target the next RED line above. For short trades, target the next BLACK line below.
**Timeframe:**
Use a 5 timeframe for trading.
**Risk Disclaimer:**
This setup is for educational purposes. I'm not responsible for your gains or losses. Check the chart for more details.
Weekly demand zoneIt is in the weekly demand zone with lower time frame confirmation (trend change confirmation) target weekly high .
Entry price. 2960
Take profit 3700
Stop loss - 2880
