[Positional] AdaniEnt Buy IdeaNote -
One of the best forms of Price Action is to not try to predict at all. Instead of that, ACT on the price. So, this chart tells at "where" to act in "what direction. Unless it triggers, like, let's say the candle doesn't break the level which says "Buy if it breaks", You should not buy at all.
=======
I use shorthands for my trades.
"Positional" - means You can carry these positions and I do not see sharp volatility ahead. (I tally upcoming events and many small kinds of stuff to my own tiny capacity.)
"Intraday" -means You must close this position at any cost by the end of the day.
"Theta" , "Bounce" , "3BB" or "Entropy" - My own systems.
=======
I won't personally follow any rules. If I "think" (It is never gut feel. It is always some reason.) the trade is wrong, I may take reverse trade. I may carry forward an intraday position. What is meant here - You shouldn't follow me because I may miss updating. You should follow the system I share.
=======
Like -
Always follow a stop loss.
In the case of Intraday trades, it is mostly the "Day's High".
In the case of Positional trades, it is mostly the previous swings.
I do not use Stop Loss most of the time. But I manage my risk with options as I do most of the trades using derivatives
ADANIENT trade ideas

Adani Enterprises (ADANIENT) for swingOrder flow analysis indicates strong buying pressure with a positive delta divergence, signaling potential bullish momentum. Additionally, there’s a gap fill due at ₹3522, which could act as a key target level. Notably, the volume profile shows a spike followed by contraction, typically a precursor to a significant price move. With these factors combined, an upward move is expected in the near term. Traders should watch for price action around the ₹3522 level, as it could confirm the continuation of the bullish trend.

Adanient - will hit 3900 (Believers, watch the cat's next step) Adanient - will Hit 3900++ before 21st Oct.
who challenge me. please comments it.

ADANIENT KEY LEVELSExplanation:
This is a very useful trading system. This means that you should not take a trade blindly, but rather that there is another confirmation to take the trade you can use this for perfect entry and perfect exit
This trading opportunity is based on volume, previous price, and price range , are included
Entry/Exit point's:
- It has very easy entry and exit points
- In this pair of lines with two colors are given (RED AND GREEN)
- In this the GREEN line is used to take long entry and the RED line is used to take short entry (But it is all based on a more conformation from your trading plan)
Stop Loss/Take Profit:
Stop Loss
- According to this, if you take a long trade, its stop loss will be the RED line just below ( A trade can exit either when the price crosses the RED line or the 5 minute candlestick crosses the RED line. (This can be done according to your preference) )
- A short entry should use the opposite rules to a long entry
Take Profit
-When you take a long entry according to the profit to be booked is on the next RED line above. ( Or if there are other reasons, it can be a safe exit )
- Opposite rules for booking profit on long entry are to book profit on short trade. ( The GREEN line above is the stop loss of short entry )
Timeframe:
According to this, the time frame you should use while taking trades is 5 minutes time frames . (5 minute time frame works well in this)
Risk Disclaimer:
Leave a comment if you like my entry setup. This share is for educational learning purposes only, and I am not responsible for your profit or loss. Note: For more details, check the chart.

Adani EnterprisesStock has been very volatile between 2750 to 3350 from 4-Dec-2024 to 22-May-2024. after a long consolidation the stock moved to 3747 levels in the recent election results euphoria which is highly speculative.
Stock is showing uptrend and one can enter around 3020 to 3190 levels and wait for a target of 3747 and 4078 in the near term
stop loss can be seen at 2725

adanient Adani Group will buy 77.5 percent stake in Coredge's parent Parserlabs India. Parserlabs owns 100 percent of Coredge.io. The cost of acquisition will be Rs. 20,000 per equity share having face value of rupee 1 each.
Via this agreement, Coredge.io, which offers AI and cloud services, will enable Sirius Digitech to provide Machine Learning as-a-Service.

ADANI .. BIG MOMENTUM COMING VERY SOONUnder this level, this scrip could go really weak .. and then we get an amazing PE oppurtunity for 3000 levels.
keep an eye out for both sides.
all the best.

Adani Ent looking soo goodAdani consolidated for so long within the last two fib stages/resistances ..
weekly has broken 60rsi and is still holding within that candle.
wait for 30min to break 60rsi and find your entry.
(in this mini bull run, big and r.e.a.l money has come into the large caps .. ye scrip ki baari boht jaldi aa rahi hai)
all the best.

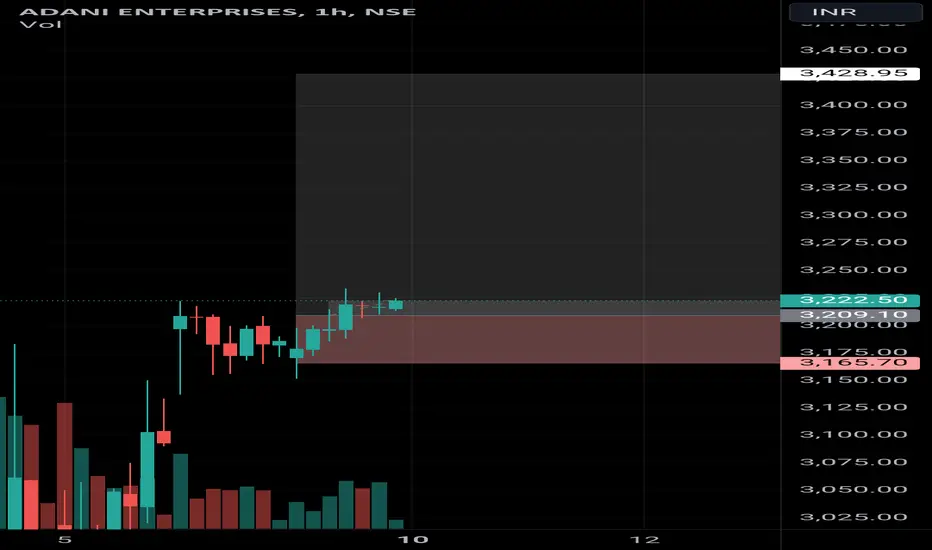
ADANI ENT continuation..ADANI ENT can give a good up move as said in previous post and showing a good entry position with a decent stoploss
ENTRY - 3230
STOPLOSS - 3165
TARGETS - 3430, 3500, 3600++
Note- if any trade or value that's gone from the marked levels then that's not our trade just let it go or wait for it to come back
I'm not sebi registered this is my personal view
Please like or boost my idea if you like it or traded it.
ADANI ENT UP MOVE??Adani ent can give a good swing to positional trade with a decent stoploss and good Targets
ENTRY - 3210
STOPLOSS - 3160
TARGETS - 3430, 3500, 3600++
Note- if any trade or value that's gone from the marked levels then that's not our trade just let it go or wait for it to come back
I'm not sebi registered this is my personal view
Please like or boost my idea if you like it or traded it
Thankyou

BUY ADANI ENT for gain of 25%With short term profit target.
Adani Ent is forming a pattern and it should break it with upside movement in coming days.
once it break the resistance level, it might go further up with the support of new government.
This is just for knowledge purpose only, invest at your own risk.
Key factors:
1. Favourable Govt.
2. High volume at resistance shows better opportunity.

Adani Enterprises Plummets.Adani Enterprises has witnessed a significant drop, with the latest trading session closing at INR 2941.25, marking a dramatic -19.31% decline. This analysis delves into the technical indicators, chart patterns, and recent market news to forecast potential price movements. Traders need to be agile and informed to navigate this volatile landscape.
The recent price action shows a sharp decline, evidenced by a long red candlestick. This bearish engulfing pattern suggests strong selling pressure, often indicating a continuation of downward momentum. The price has broken through several key support levels, causing a cascading effect on trader sentiment.
Moving Averages
50-day EMA: 3131.39 (Sell)
200-day EMA: 2825.15 (Buy)
9-day Hull MA: 3354.43 (Sell)
The 50-day EMA is positioned well above the current price, reinforcing the bearish sentiment. The 200-day EMA, however, still signals a longer-term buying opportunity, suggesting potential for a rebound if the price stabilizes around this level.
Oscillators
RSI (14): 42.92 (Neutral)
Stochastic %K (14, 3, 3): 66.57 (Neutral)
MACD Level (12, 26): 65.52 (Buy)
Momentum (10): -176.25 (Sell)
The RSI remains neutral, indicating neither overbought nor oversold conditions, which could suggest a period of consolidation. The Stochastic %K aligns with this view, showing a lack of definitive trend. The MACD, however, offers a glimmer of bullish potential, countered by negative momentum.
The immediate support level at 2958.95 has been breached, suggesting a potential fall towards S2 at 2506.55 if selling pressure persists. Resistance levels indicate significant upward hurdles, with R1 at 3660.80 being the first major test for any recovery.
News Impact
Recent news has heavily impacted Adani Enterprises, with reports of regulatory scrutiny and market skepticism about valuations contributing to the sharp decline. Investors are reacting to potential long-term implications, affecting both sentiment and trading volumes.
Long Position
Entry Point: If the price stabilizes above the 200-day EMA (2825.15), consider entering a long position.
Stop Loss: Set a stop loss at 2700 to mitigate downside risk.
Target: Initial target at R1 (3660.80), with potential to extend to R2 (3910.25) if bullish momentum strengthens.
Short Position
Entry Point: If the price continues to decline past the 200-day EMA, enter a short position around 2825.
Stop Loss: Set a stop loss at 3000 to protect against unexpected reversals.
Target: Target S2 (2506.55) for a conservative approach, extending to S3 (1804.70) for a more aggressive strategy.
Conclusion
Adani Enterprises faces significant headwinds, with technical indicators predominantly bearish and market sentiment heavily influenced by recent news. Traders should remain cautious, leveraging stop losses and closely monitoring key support and resistance levels to navigate this volatile environment. Short-term traders might find opportunities in both directions, while long-term investors should assess the fundamental impacts before making decisions.
Price Prediction
Bearish Scenario: INR 2506.55 (near-term), INR 1804.70 (if bearish momentum continues)
Bullish Scenario: INR 3660.80 (rebound potential), INR 3910.25 (sustained recovery)

Adani enterpriseAdani enterpise is at its resistance level. It is testing its resistance level. Considering the political situation in india one can go for swing trade in adani.

ADANI ENTERPRIESEThis stock breakout major resistance level and TGT will be 20% upside
this is only for educational purpose only

Adani Enterprises (ADANIENT) ForecastThis chart depicts the daily price movements of Adani Enterprises (ADANIENT) on the NSE. Here’s a summary of the key observations and potential implications:
Chart Analysis:
1. Trend Lines:
-Ascending Channel: The chart shows an ascending channel pattern with two parallel trend lines, indicating that the stock has been trading within this upward channel since early 2023.
- Support Line: The lower trend line acts as support, preventing the price from falling further.
- Resistance Line: The upper trend line acts as resistance, capping the price increase.
2. Current Price Action:
- The current price (3,384.95 INR) is near the upper resistance line of the ascending channel.
- The stock recently experienced a strong upward move, pushing towards this resistance level.
3. Key Levels:
- Resistance Level: Around 3,590.60 INR, which corresponds to the upper boundary of the ascending channel.
- Support Levels:
- Around 3,000 INR, aligning with the lower boundary of the ascending channel.
- Additional support near the 2,600 INR mark, providing a secondary level of support in case of a significant pullback.
Potential Implications:
1. Bullish Scenario:
- If the price breaks above the upper trend line (3,590.60 INR) with strong volume, it could signal a bullish breakout, potentially leading to further gains.
2. Bearish Scenario:
- If the price fails to break the resistance and reverses, it might move back down towards the support line of the ascending channel, around 3,000 INR.
- A breakdown below the lower trend line could indicate a bearish reversal, possibly leading to further declines towards 2,600 INR or lower.
3. Neutral/Sideways Movement:
- If the price remains within the channel, it may continue to trade sideways, oscillating between the support and resistance levels.
Conclusion:
- The chart shows that Adani Enterprises is currently at a critical juncture near its ascending channel's resistance level.
- Investors should watch for a breakout above the resistance or a reversal to gauge the next major move.
- As always, it is advisable to combine this technical analysis with other factors such as fundamental analysis, market news, and broader market trends before making any trading decisions.

Adani Enterprises BuyHello, Friends in this stock you can see market break out up site falling channel with good volume it's most probability to market will go up site and good time to enter here I hope you like my ideas thank you.

Adani Enterprises: Modi 3.0Break out
FII Flow
Modi 3.0
Amazing combination
Company has delivered good profit growth of 44.3% CAGR over last 5 years
Debtor days have improved from 47.5 to 37.1 days.

ADANIENT SWING TO POSITIONAL Adani ent can give a good swing to positional trade with a decent stoploss and good Targets
ENTRY - 3145- 3150
STOPLOSS - 3100
TARGETS - 3250, 3300++
Note- if any trade or value that's gone from the marked levels then that's not our trade just let it go or wait for it to come back
I'm not sebi registered this is my personal view
Please like or boost my idea if you like it or traded it
Thankyou

Will Adani Loose? Indian Elections - ProspectiveDespite Nifty showing Bullish and Bearish Signals Adani Group is forming the parallel channel We are not quite sure as the market is still in a retesting position if the market continues to reject we can expect Adani to make Low to 700 rupees from 3000 rupees!!!! Is this connected with the elections? I am quite sure that it is If The NDA forms the government again yes it will shoot up and if not then it is going to crash suddenly Be ready to see the blood in the Indian Markets soon or the green flags after the election results.

Adani Ent: EnterprisingLong Consolidation
With Bear Attack on the Way
Possible Inverted H & S
Green Channel Support
Elections 2024
Could be a thrust beyond Rs 3100 into a new Space.

BUY AROUND 1780 TGT 1950/2150 AVG @ 1680 SL BELOW 1540 The business model is growing at a very brisk pace and currently invested heavily in other sectors too looking a life time breakthrough for the stock and above mentioned target can be easily achieved with given stop loss

Adani enterprises in Neutral modeThis stock in neutral mode - means neither good for selller or buyer
Advice --
For quity trader --
please trader according to my red Trendline price and sell above Trendline
-- stopp loss is mandatory if Trendline broken
For option trader -- seems market can go up 200-300 points to touch upper red Trendline
For more chart analysis comments me in this post.

Adani Ent. ready for another upswing?
After almost sideays movement for a month, i think Adani Enterprise is ready for next leg of upswing.
