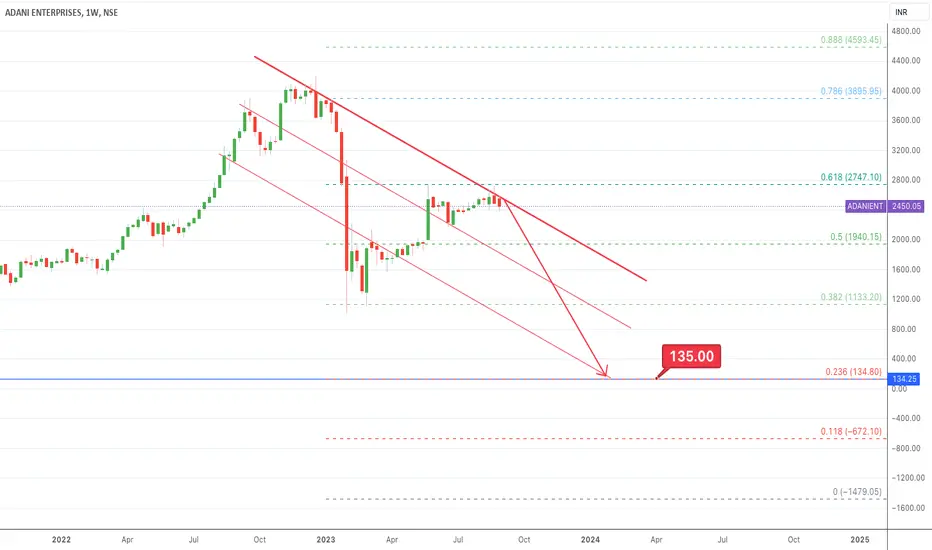
adanient...ready for breakout for 3800keep an eye 3800 as it break out or breakdown. and if breakdown it may fall upta3100
ADANIENT trade ideas

Adani EnterprisesFlag pattern is forming in Adani Enterprises from where breakout can be seen on the upper side.

ADANIENT: Rocket Move Towards All-Time Highs?🚀📈Title: "ADANIENT: Anticipating a Rocket Move Towards All-Time Highs, Eyes Set on 6100 INR in the Next 4 Years! 🚀📈"
Description:
Embark on an exciting journey with ADANIENT as we anticipate a rocket move propelling the stock towards all-time highs. NEOALGO's analysis suggests a potential surge, with a bold outlook projecting a target of 6100 INR over the next four years. Our optimism stems from the formation of strong order blocks, indicating a robust upward trajectory.
This is our personal view, envisioning golden days ahead for Adani. The anticipation of a substantial upmove is underpinned by the promising order blocks, shaping a positive narrative.
Keep in mind, NEOALGO is not SEBI registered, and investors should conduct thorough research. Decisions made directly impact potential profit or loss.
Embrace the excitement, explore the potential of ADANIENT, and consider the optimistic future detailed in our analysis. 🌟📊 #ADANIENT #RocketMove #GoldenDaysAhead #OptimisticOutlook

ADANIENT - may soon give breakout The results are very good , so the has momentum to go up .
Entry - above 3219
SL - 3% or your risk
Tgt - 10% and trailing SL
Note - I think everyone how adani stocks work. Its always advised to keep booking profits if you are in green. Please note this is a risky stock


Buy AdaniEnterprises on Weekly or daily timeframeBreakout then retest and again breakout.Its a solid buy entry with stoploss of around 200rs and target of around 800+rs i.e 1:4 RR

Adani Enterprise is Near to its Breakout for going To ATHAdani Enterprise can we give break out and will go till 3600 in one short so we can add this in our Watchlist

MBlock at Nascent StageThis is highly risky as the trend lines have not formed yet, this is just an early call and if it follows the grey line then T1 is Highly Achievable

Adani Ent Levels for TomorrowThe yellow marked lines are important levels of Adani Ent for Tomorrow. One can use them as support and resistance levels.

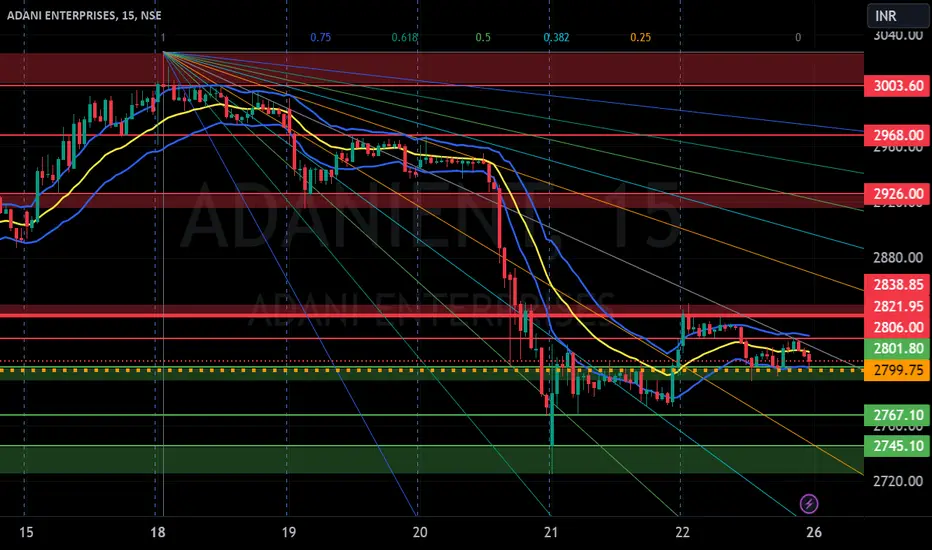
ADANII ENT S/R for 26/12/23Support and Resistance Levels:
Based on the price action, you have to identify two significant levels: the red line acting as resistance and the green line acting as support. Additionally, there have marked red and green shades to represent resistance and support zones, respectively.
Support: The green line and green shade represent support levels. These levels are where the price tends to find buying interest, preventing it from falling further. Traders can consider these levels as potential buying opportunities.
Resistance: The red line and red shade represent resistance levels. These levels are where the price tends to encounter selling pressure, preventing it from rising further. Traders can consider these levels as potential selling opportunities.
Breakouts: If the price breaks above the resistance zone (red shade) convincingly, it may indicate a bullish breakout, and the price could move higher to the next resistance level. On the other hand, if the price breaks below the support zone (green shade) convincingly, it may indicate a bearish breakout, and the price could move lower to the next support level.
Keltner Channel:
The Keltner Channel is a technical indicator that uses an exponential moving average (EMA) to create an upper and lower channel around the price action. Traders can use this channel to identify potential long and short positions.
Long Position: If the price is above the upper line of the Keltner Channel, it may indicate a potential long opportunity, as it suggests the price is trading above the average range and might continue in an upward trend.
Short Position: If the price is below the lower line of the Keltner Channel, it may indicate a potential short opportunity, as it suggests the price is trading below the average range and might continue in a downward trend.
Disclosure: I am not SEBI registered. I just wanted to let you know that the information provided here is for learning purposes only. Please consult your financial advisor before making any decisions. Tweets neither advice nor endorsement.
BuyI looked in chart this pattern and want to share chart for experts advice so any one who looked this chart please respond back and correct me thank you for your advice

adanient investors like GQG and Abu Dhabi conglomerate International Holding
IHC
into some of its companies, helping to dilute the family’s tight shareholding. The tycoon also paid off loans backed by stock: only 2.4% of the shares in Adani Ports, for example, remain pledged as of the September quarter, down from 17.3% at the end of December 2022.
The reckoning stress tested concerns about the group’s rapid growth, leverage and valuations. While net debt remains largely unchanged at around $22 billion, EBITDA – a rough proxy for cash flow – has risen, reducing the consolidated ratio from 3.3 times to 2.5 times. The four largest businesses by market capitalisation trade between 89 and 202 times trailing earnings, per LSEG data. While high, those multiples are lower than the 315 to 845 times before Hindenburg made a splash.
Meanwhile, Adani’s blue-chip backers including TotalEnergies
TTE
, Wilmar International
F34
and its coterie of global banks including Standard Chartered
STAN
and Singapore’s DBS
D05
remained loyal. And Florida-based GQG Partners, which made big bets on the conglomerate this year, has seen the value of its investments in five group companies soar this year.

Adani Enterprises is at major support.The most infamous stock in the Indian stock market in recent times- Adani Enterprises, has reached a very crucial support area and is probably attempting a bounce from here.
The chart is based on very simple concepts of Support/Resistance, Horizontal consolidation areas(HCR's) and trend lines. Nothing too complicated here, the entry too is pretty straight forward.
For a short term trade ,enter on trend line break confirmation and aim the HCR lower boundary for target.
The low at 2142 is crucial reversal point as of now and will act as a SL.
One important thing to note in this chart is the lack of volume confirmation for the past 2 months fall. What does a fall without volume confirmation mean? Is it bullish or bearish?
keep an eye on the stock and you will find for yourselves(:P).
CMP 2196
SL 2140
Target 1 - 2370
Target 2 - 2600

ADANIENT--@Trendline Break??this stock is trending downwards..
now the price is at support zone...
keep in short as long as price breaks this trendline...
if it failed to break the trendline it will continue its fall...
keep safe before short...
On bottom side we have a demand zone lies at 1900 levels...
look for buy ,if price comes back to the support.
on topside we have a strong resistance area at 2500...
if price breaks the this trendline and retest then chances are more to test the resistance again..

[Positional] Adanient Buy IdeaDon't buy unless it triggers.
Here’s a basic analysis based on the candlestick chart:
The stock has been in a downtrend as indicated by the series of red (down) candles.
There appears to be a sharp decline in the most recent periods without signs of reversal.
The lack of green (up) candles indicates sustained selling pressure.
Given the apparent downtrend without immediate signs of recovery, it is currently a sell trade.

The Adani SagaAdani Enterprises (ADANIENT) has shown good recovery and has been in long consolidation since its last burst in May 2023 when Supreme Court granted SEBI Time for investigation.
It has taken a strong support at 2370 -2400 and today it has made a doji right at its support to suggest a reversal. While it is waiting for the next date in Supreme Court, there is an opportunity to enter at CMP as it offers a low risk opportunity.
Keeping 1 ATR as SL, it Is good to go long on Adani enterprises regardless of outside noise. Expecting a very big move soon coming out of a 4 month narrow consolidation phase after the Supreme Court hearing.
Not keeping any targets in this trade because this stock would move big and fast . I would prefer to keep moving my TSL up if my view turns out right.

ADANIENT--Breakout or Breakdown??I am sharing the important levels of Support and Resistance. These levels play a crucial role in trading decisions, as they act as reliable markers of price movements.
------>>Support levels are price points where an asset tends to find buying interest, preventing it from falling further.
---->Resistance levels, on the other hand, are points where selling pressure typically prevents the asset from rising higher.
If price breaks the resistance, we have a chance of filling the bearish gap, soo keep in buyside until it touches the zone of resistance and bearish gap.
Take a look at these levels and trade accordingly. Recognizing and respecting these support and resistance levels can help traders make informed decisions and manage risk effectively. They serve as key reference points for technical analysis and are vital tools in successful trading strategies.
Trade safe...Thank you guys for your support

Adani Ent Swing TradeAdani Ent is ready for the possibke breakout and looking for long opportunity,
Time Period - 1 Week to 1 Month,
so Dont miss any of the Adani Group stock

Trading near Support @2425Trading near support zone 2400-2450.
May bounce back to 2500-2600 levels.
It is just an idea. Trade at your own risk and consult your financial advisor before Trading or investing.

Adani enterprises upside started we took 100+ points on downsideOn Our Harmonic pattern indicator based trade setup take trade as explained below :-
Early trades Buy or sell below/ above 23.6 %, safe trades buy or sell above / below 41% , after taking trade next upside or downside levels will be target ,
When reverse buy or sell signal appear then book profit on Target or trail SL to 23.6 % If trailing SL hit then early trade can be taken above or below 23.6 and safe trade can b taken above/ below 41% ..
Please note:-
It's working on news based and volitile market very well so exit if SL hit

Adani enterprises looking weak 2440 For all trade on my Auto Harmonic patterns indicator trade setup -
Risky trades can take trade after crossing 23.6% on either side and safe traders can take trade after 41% We can start buying when our Trailing SL hit at 23.6% with SL of recent low our Target will be 41%, 78.6% , 127.2% 161.8% and 223.6 % , when reversal pattern appears on chart we have to trail our SL if trailing SL hit exit from long trade and initiate sell trade ,

ADANIENT ViewsThere can be a range bound long trade in the script as it is reacting around the value area.
It will be exciting to add this script in watch list for study purposes.
