Adani to find its way down to 75 supportI dont have much to say about this... All other companies which entered a correction went down to roughly their 2017 levels, I see no reason why this scam wont, and on top of it they are a representation of the country which is helping Russia in the Ukraine war.
ADANIENT trade ideas

Purely technical take on Adani sagaNSE:ADANIENT
My purely technical take on Adani saga. What happens here is important going forward with respect to this high volume area andAVWAP


Adani ENT Looks good on Chart.Adani Ent Looks good on Chart.
If you are a risky trader then Long Adani ENT. for the target of 2100.
Strict SL 1350.

Adani Enterprises ViewAdani Enterprises looks pretty good on a daily timeframe basis forming a Hammer pattern which is signalling a U-turn in a downtrend. Beside this, another noticing point is that on a daily timeframe, 50EMA is going to cross 100EMA which creates quiet confusion. However, we could not determine whether it will show a more down move or an up move. This will be clear after the formation of next day candle.
Though company is fundamentally going well as per our perspectives. But the arousal of political interventions created havoc in the stocks of Adani.
Hoping it will recover from this low.
Near term resistance is seen at or near 2100-2200. From this level only we can clearly predict which side will it move.
🙏 Thanks


ADANI FALLS AS PREDICTEDI shared my analysis on ADANIENT Last year December, there are people who laughed at me and think I was crazy, I said ADANI stock was over-extended and that soon was going to fall heavy... and now its falling heavily

Adani Group Group index all time lowThe Adani group stock index is now in the all time low level breakcout this is not good for the Adani Group

Adani Enterprises Larger trend is negative & likely to continue Today is Friday! 💰 Adani Stocks might see some support 🤞
⚠️ Beware! 📉 The larger trend is negative & likely to continue for months
🚫 Avoid stocks trading below the declining 200 Day Moving Average 📈

Short to get Target of 1600-1700 within 3 MonthsAccording to the chart pattern it seems week in Monthly and weekly time Frame seems like it will touch 1600-1700 level, if it sustain above 2600 then it will move al the way up. it is for education purpose do paper trade or by your own research.

ADANI GROUP BUBBLE POP!As many of you know adani group has showed a crashed over recently due to accounting fraud... for moment its owener must be mad about it but also has sold it long time ago.. for moment its a sell if u can get it.. the price to start sell was around 40

Adani Enterprises Positional View Weekly Analysis @ 02-02-2023Adani Enterprises came to 1st Opportunity, All the Important Levels are Marked on the Chart
The Business Model is good for Adani Empire, Second Biggest Company in India
I will be more Happy if i get another dips, Will Update this idea & decisions in coming months
Always Trade What You See not What You Feel........
"Be Fearful when others are Greedy and Greedy only when others are Fearful " - Warren Buffett
John Maynard Keynes said, “the markets can remain irrational longer than you can remain solvent.” So be cautious and flexible as market conditions evolve.
Than You Universe 🙏🙏🙏💐 Thanks to all my Teachers ....🙏🙏🙏💐

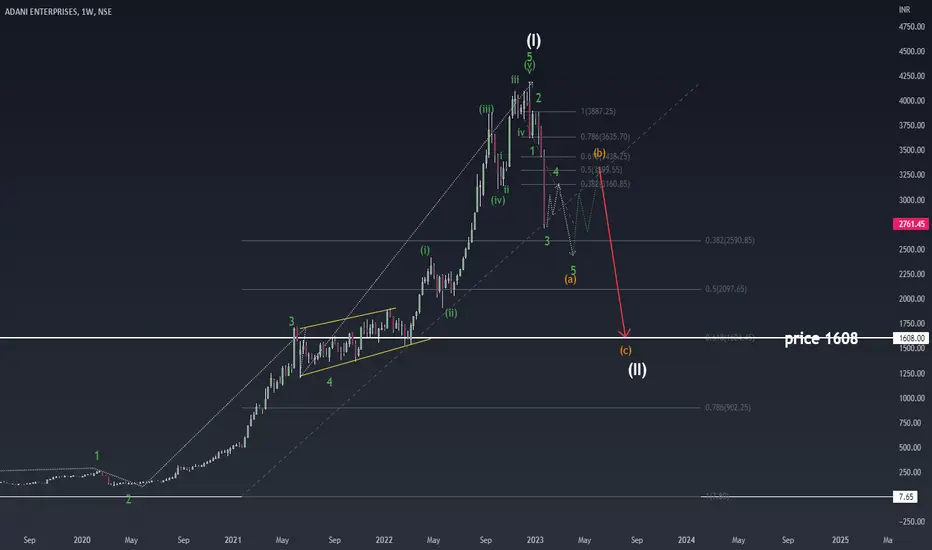
ADANI ENTERPRISES let's see what Elliott wave say?I was observing Adani enterprises since it was above 4100 range.
And was thinking it will move to very low level but was not sure of the trigger
It had completed its 5 wave and a divergence was being seen when the price was at high.
Now i think the wave 2 is in progress of higher degree, but the price may not come so fast in my view.
Be safe from any trap that's why I have given you this chart.
Regards
ADANI EMPIRE END❓Hello,
what you can say about Adani's bubble blast ?,
is it a opportunity to reinvest at discounted price ?
OR plan swing on pullback?
Or go for another stock ?
Let's discuss in comment section

Adani enterprises Semi Strong which suggest that the price of Adani Enterprises Ltd is likely to Rise-somewhat in the short term. However, please check the rating on Quality and Valuation before investing.

Nice drop and a good bet for a dead cat bounce ?Oversold with a W on oscillator.
Historically gave a nice risk/reward at these levels.

Adani Enterprise heading to 1200?Adani Enterprise heading to 1200?
Looks like a morally bankrupt company, heading to a technical distressed level soon?
Most probably heading to INR 1200 level soon in next few weeks?

Adani dump reached support levelCon allegations caused a sudden plunge in price, which dropped to the 15 minute Cosmic Channel Lite support. Considering the magnitude of the volatility, a rebound or flattening are two ensuing possibilities, with the latter likely given the nature of the news.

ADANI ENTERPRISESAdani Enterprises gains of 182 days destroy in 42 days Now Adani Ent lost its capitalisation by 49% Now can it stop ??? Or can hold Lets see

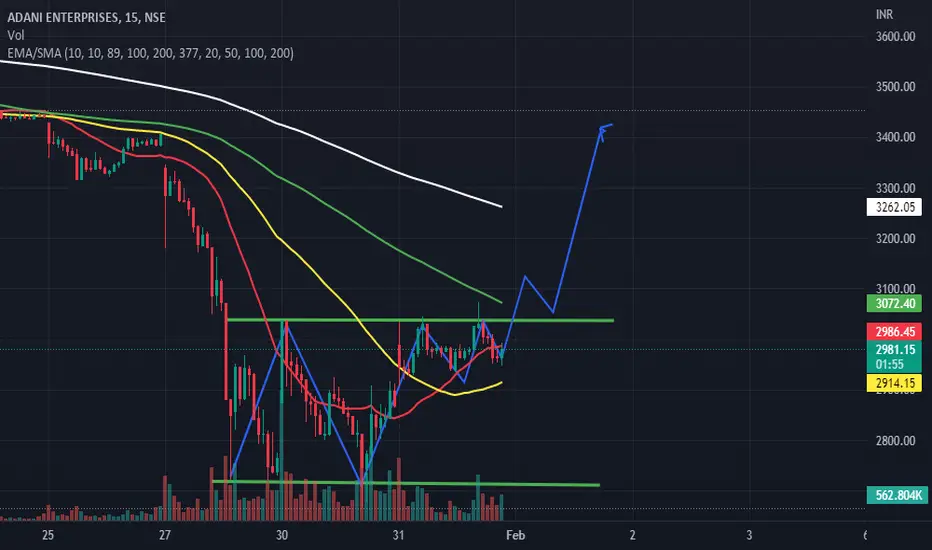
Long Adani ENT.Adani ENT Looks good on Charts.
AdaniENT if Closes above 3000 then we may see 3300-3400 levels Coming soon in 3-4 days.
As per Fundamentals, Call Writers are being Trapped and may book losses. so I expect a short Covering Move from this Levels.
Enjoy your Profit Traders.
ADANI ENETRPRISES 💚🤣💔hello ji,
==========================================================
Here we all know about ADANI STOCK.
And make reverse head and shoulder. 💚💚💚🤞
Here ADANI ENETRPRISES IS IN a make and break levels.
If ADANI stock are bullish tomorrow then market also bullish
else: market is bearish.
THANK YOU... 🙏🙏🙏
==========================================================

Adani Enterprise It has formed a negative triple divergence on the chart with three black crows candle stick patterns.

Adani Enterprises Weekly ChartAdani Enterprises weekly chart facing resistance at Weekly TL. Stock is in sell on rice mode.
