Ajanthpharma looking bullishAjanthpharma looking bullish - with debt resturcturing and expected good Year
AJANTPHARM trade ideas

SWING IDEA - AJANTA PHARMAAjanta Pharma , a mid-cap pharma player with strong branded generics in ophthalmology, dermatology, and cardiology, is showing a compelling swing trade setup backed by a high-probability technical breakout.
Reasons are listed below :
Bullish engulfing candle on the weekly timeframe, indicating reversal strength
2,500 zone acting as a crucial support
Holding above 0.382 Fibonacci retracement level , suggesting healthy correction
Price trading above 50 & 200 EMA on the weekly chart – long-term strength intact
Breakout from narrow consolidation near the 50-week EMA
Target - 3080 // 3400
Stoploss - weekly close below 2415
DISCLAIMER -
Decisions to buy, sell, hold or trade in securities, commodities and other investments involve risk and are best made based on the advice of qualified financial professionals. Any trading in securities or other investments involves a risk of substantial losses. The practice of "Day Trading" involves particularly high risks and can cause you to lose substantial sums of money. Before undertaking any trading program, you should consult a qualified financial professional. Please consider carefully whether such trading is suitable for you in light of your financial condition and ability to bear financial risks. Under no circumstances shall we be liable for any loss or damage you or anyone else incurs as a result of any trading or investment activity that you or anyone else engages in based on any information or material you receive through TradingView or our services.
@visionary.growth.insights

AjantaPharma ,1W , Bullish it has Formed a Very Good Pattern in Weekly and giving Breakout ,Take the Trade after Strong Weekly Close and put the Sl below its Swing low and Follow Proper Risk Management
Follow for More Swing Ideas like this

Ajanta pharma is looking good for upsideAjanta pharma is trying to breakout from consolidation and triangle and trend line breakout. Keep an eye for breakout. Stock already showing more volumes from last few days.

[Swing Trade] AJANTPHARM breakout above 3,115 is expected.AJANTPHARM
Analysis
A triple bottom pattern is clearly visible here.. with the price bouncing off the 2,800 thrice,I think 2800 is acting as strong support.. from my view, it is signalling a reversal in a downtrend, may be bullish trend potentially
If I happen to enter, I may wait for a breakout above 3,115 with price above all the MAs and also I will wait for strong volume around this price.
On 13th jan price has taken support on 200dma. It is also confirming the reversal.
DYOR before you invest. This is purely for education purpose.

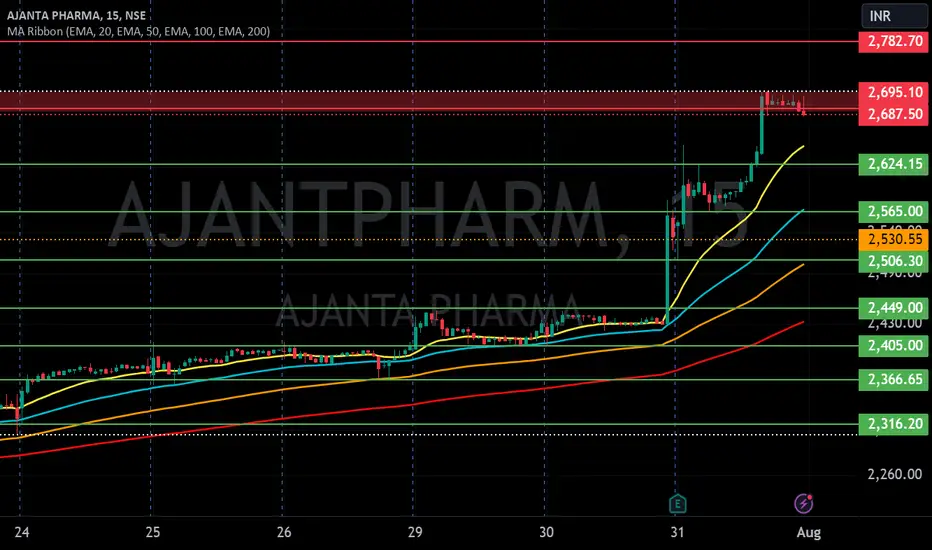
AJANTA PHARMA LTD S/RSupport and Resistance Levels:
Support Levels: These are price points (green line/shade) where a downward trend may be halted due to a concentration of buying interest. Imagine them as a safety net where buyers step in, preventing further decline.
Resistance Levels: Conversely, resistance levels (red line/shade) are where upward trends might stall due to increased selling interest. They act like a ceiling where sellers come in to push prices down.
Breakouts:
Bullish Breakout: When the price moves above resistance, it often indicates strong buying interest and the potential for a continued uptrend. Traders may view this as a signal to buy or hold.
Bearish Breakout: When the price falls below support, it can signal strong selling interest and the potential for a continued downtrend. Traders might see this as a cue to sell or avoid buying.
MA Ribbon (EMA 20, EMA 50, EMA 100, EMA 200) :
Above EMA: If the stock price is above the EMA, it suggests a potential uptrend or bullish momentum.
Below EMA: If the stock price is below the EMA, it indicates a potential downtrend or bearish momentum.
Trendline: A trendline is a straight line drawn on a chart to represent the general direction of a data point set.
Uptrend Line: Drawn by connecting the lows in an upward trend. Indicates that the price is moving higher over time. Acts as a support level, where prices tend to bounce upward.
Downtrend Line: Drawn by connecting the highs in a downward trend. Indicates that the price is moving lower over time. It acts as a resistance level, where prices tend to drop.
Disclaimer:
I am not a SEBI registered. The information provided here is for learning purposes only and should not be interpreted as financial advice. Consider the broader market context and consult with a qualified financial advisor before making investment decisions.

AJANTA PHARMA ON THE CUSP OF A MONTHLY TF BREAKDOWNAJANTA PHARMA may correct upto 2800 In the coming weeks. wait for it to complete a H&S PATTERN ON A 4 HOUR TIMEFRAME.a correction is long overdue on a monthly Timeframe. LOOK FIRST /THEN LEAP.

Ajanta Pharma - A multibaggerAjanta Pharma is primarily engaged in development, manufacturing and marketing of specialty pharmaceutical quality finished dosages. It has business in India, U.S and other countries like Philippines, Middle East and Africa.
Business Strategy and margin revival:
- Three pillars: Smart product selection, superior formulation development capabilities, focused business segments.
- Will focus on branded generic business and allocate more resources on product registrations, team, and launch of new products which will increase marketing expenses.
- FY23 EBITDA margins were impacted from higher raw material prices, higher freight costs and US price erosion. Management expects it to climb back to about 25% in FY24.
Some details of the company-
Return on capital employed >30 AND
Debt to equity <0.1 AND
Net profit preceding 12months >500 AND
Net Profit latest quarter >100
I am not a SEBI registered analyst.
Please do your own analysis before investing.
Do like and follow and share among your friends and family.
Thank you.

AJANTA PHARMA S/R Support and Resistance Levels: In technical analysis, support and resistance levels are significant price levels where buying or selling interest tends to be strong. They are identified based on previous price levels where the price has shown a tendency to reverse or find support.
Support levels are represented by the green line and green shade, indicating areas where buying interest may emerge to prevent further price decline.
Resistance levels are represented by the red line and red shade, indicating areas where selling pressure may arise to prevent further price increases. Traders often consider these levels as potential buying or selling opportunities.
Breakouts: Breakouts occur when the price convincingly moves above a resistance level (red shade) or below a support level (green shade). A bullish breakout above resistance suggests the potential for further price increases, while a bearish breakout below support suggests the potential for further price declines. Traders pay attention to these breakout signals as they may indicate the start of a new trend or significant price movement.
20 EMA: The yellow line denotes 20 EMA, to interpret the 20 EMA, you need to compare it with the prevailing stock price. If the stock price is below the 20 EMA, it signals a possible downtrend. But if the stock price is above the 20 EMA, it signals a possible uptrend.
Disclosure: I am not SEBI registered. The information provided here is for learning purposes only and should not be interpreted as financial advice. It is important to consult with a qualified financial advisor before making any investment decisions. Tweets neither advice nor endorsement.
Review and plan for 31st July 2024Nifty future and banknifty future analysis, stocks to watch and intraday plan in kannada.
This video is for information/education purpose only. you are 100% responsible for any actions you take by reading/viewing this post.
please consult your financial advisor before taking any action.
----Vinaykumar hiremath, CMT

AJANTPHARM LongIt has retested the breakout level. It fell hard yesterday but it sustained above the support level. Do analyze in the higher TF as well and decide what is to be done.

flag patternflag pattern ..enter after breakout or enter between 1228-1265 level with 1221 as stoploss for a target of 1327 -----1370-------1390-------------1424


AJANTPHARMNSE:AJANTPHARM
One Can Enter Now ! Or Wait for Retest of the Trendline (BO) Or wait For better R:R ratio
Note :
1.One Can Go long with a Strict SL below the Trendline or Swing Low of Daily Candle.
2. Close, should be good and Clean.
3. R:R ratio should be 1 :2 minimum
4. Plan as per your RISK appetite
Disclaimer : You are responsible for your Profits and loss, Shared for Educational purpose

Ajanta Pharma-Nice breakout.Ajanta Pharma-Nice breakout.
Capital to be deployed- 20k
Price -1491/1505
Stoploss-1351
Targets-1791
#ajantapharma #nifty50 #NiftyBank #investment #StockMarket #StocksToBuy


AJANTPHARM - Weekly AnalysisIn the Weekly Chart of AJANTPHARM ,
we can see that, after retest it has given a strong pullback.
possibilities are shown in charts.

AJANTAPHARMA view above 1253AJANTAPHARMA view above 1253
Please follow strict risk reward and stop loss if you follow my levels...
Charts for Educational purposes only
Thanks,
V Trade Point

Ajanta Pharma Strong resistance breakoutNSE:AJANTPHARM
Ajanta pharma has given a strong breakout with increasing volume and in medium term it can give good returns. It has also crossed 200 days MA. Nifty pharma has corrected from 14000 to 12000 (almost 15%) and now recovering from bottom.
CMP - 1333
Target 1 - 1450
target 2 - 1550
SL - 1250
Disclaimer: This is for educational purpose only. Take advise from your financial adviser before investing.

Chart of the week! Channel BREAK OUT.BUY at LTP. SL 2170.TARGET 2500.Book 50% Profit AT 2500.EXIT remaining 50% When PRICE closes below 50 EMA.HAPPY TRADING FRIENDS!

Ajanta Pharma : long : target 15%- R/R = 3
- AVWAP resistance at 2214
- RS +ve and trending up.
- Pharma index getting stronger

AJANTA PHARMA SHORT TERM SWING TRADE!Hi everyone, Ajanta pharma short term swing trade consider buy above 2,240 target 2,395 & 2,435 stoploss 2,165.
LOGIC BEHIND TRADE : Stock is trading range bound soo buying on support and selling at resistance & can consider buy on support 2,117-2095 stoploss 2,080. Looks good for short term swing trade & best thing to do in range bound stock. Double conformation from Rsi if crosses 63 can hold stock until Rsi level 74. NSE:AJANTPHARM

Breakout with momentum Buy Ajanta pharma for higher targetBuy Ajanta Pharma at 2140 for targets of 2297 and 2492
