ALLCARGO LOGISTICS at Best Support !!This is the 4 hour Chart of ALLCARGO LOGISTICS.
ALLCARGO is having good law of polarity at 33 range .
Price action confirms a retest of the support zone at 33 range.
Price action indicates a bullish HH-HL formation.
If the support level sustains, the stock has the potential to make a new high.
Thank You !!
ALLCARGO trade ideas

ALLCARGO- Lets Fill In it our CARGO!!The provided image is a technical analysis chart of Allcargo Logistics Ltd. based on weekly timeframes.
Below is a summary of the key observations:
1. Price Action & Trend
The stock is currently trading at ₹32.97, down by -3.74%.
There has been a notable decline from previous highs, indicating a downtrend.
The price has fallen below the key support levels around ₹44.36 and is testing lower levels.
2. Elliott Wave Analysis
The chart appears to follow the Elliott Wave Theory, with a five-wave impulse (1-5) followed by an ABC corrective wave.
The ABC correction seems to be completing, with Wave C nearing its bottom.
3. Fibonacci Levels
A key Fibonacci retracement level (0.786 at ₹28.59) is marked, acting as a significant support.
The 1.618 Fibonacci extension (₹173.76) suggests a potential long-term bullish target if reversal happens.
4. Support & Resistance Levels
Support: Around ₹28.59 (Fib level) and possibly ₹9.48 (historical low).
Resistance: At ₹44.36 and a higher target at ₹98.00.
Major resistance exists at ₹164.11, which aligns with previous peaks.
5. Potential Outlook
If the stock holds above ₹28.59, it may consolidate or attempt a reversal.
A break below this level could lead to further downside.
Long-term investors might look for signs of reversal before entering.

ALL CARGO LOGISTICS LTD 1WAll Cargo Logistics' is demonstrating a bullish CYPHER HORMONIC PATTERN in its stock price
Key Characteristics of a Cypher Harmonic Pattern:
XA Leg: The initial downward move from a potential high.
AB Leg: A retracement of the XA leg, often around 38.2% to 61.8% of XA.
BC Leg: An extension of the AB leg, typically exceeding the XA leg.
CD Leg: A potential reversal leg, aiming to retrace around 61.8% to 78.6% of the BC leg.
I'm not a SEBI-registered analyst. All posts and levels shared are just for educational purposes. I'm not responsible for any losses or profits. No claims, all rights reserved

ALLCARGO Logistics are Stablishing and Sustaining in PerformanceNSE:ALLCARGO
...................................................................................................................................................................................................................................................................................................................................................
KEY BUSSINESS HIGHLIGHTS
Global events coupled with high demand across trade lanes during the second quarter of 2024 (calendar year) has led toimproved volumes and increased freight rates. Demand is expected to continue through the peak season till end of theyear.
LCL volume for the quarter ended June’24 stood at 2.25 million CBM, similar on YoY basis and representing a QoQ growth of6%. FCL volume for the quarter stood at 156K TEUs, similar to last quarter and up 9% on a YoY basis.
ECU Worldwide onboarded a new leadership team in Argentina, Uruguay and Paraguay as part of growth initiatives in LatinAmerica.
Contract Logistics business has reported a revenue growth of 13% on a QoQ basis and 22% on a YoY basis on the back ofincreased wallet share from existing clients.
Express Business: Operating cost continues to get optimized to bring about future growth in EBITDA. For Q1FY25 EBITDAstood at Rs. 20 crores, up 11% YoY and 33% on QoQ basis
...................................................................................................................................................................................................................................................................................................................................................
Supply chain market is estimated to be at ₹63,000
crores.
• ASCPL is a leading pan india 3PL player with an
expansive network
• Market leadership in chemical warehousing and
dominance in western India
• Building strengths in auto & engineering and ecommerce
...................................................................................................................................................................................................................................................................................................................................................

VOLUME BREAKOUT...NSE:ALLCARGO trade @ 71.40 Suppport @ 58.50 Resistence @ 78.50
on the chart seen a higher volume breakout. You can watch it as a Next Resistence @ 98

AllcargoAllcargo is looking good for swing with a target of around 4-5%. Trendline breakout is successful wait for the last swing breakout. Only for educational purpose.

Risky + Doble Digit - ALLCARGO📊 Script: ALLCARGO
📊 Sector: Logistics
📊 Industry: Miscellaneous
Key highlights: 💡⚡
📈 Script is trading at upper band of BB and giving breakout if it.
📈 MACD is giving crossover .
📈 Right now RSI is around 63.
📈 Price increasing along with volume which indicate Volume Breakout.
📈 One can go for Swing Trade.
⏱️ C.M.P 📑💰- 85
🟢 Target 🎯🏆 - 92
⚠️ Stoploss ☠️🚫 - 81
⚠️ Important: Always maintain your Risk & Reward Ratio.
✅Like and follow to never miss a new idea!✅
Disclaimer: I am not SEBI Registered Advisor. My posts are purely for training and educational purposes.
Eat🍜 Sleep😴 TradingView📈 Repeat 🔁
Happy learning with trading. Cheers!🥂

Allcargo, Weekly time frameAllcargo, Making VCP patterns with minimum volume. Showing a promising chart for the ballistic move to come. Share your thoughts on it guys.


BUY ALLCARGO PRICE @254 ROI 55% EXPECTEDBUY ALLCARGO PRICE @254 ROI 55% EXPECTED
Buy1 cmp entry @254
Target 1 @383
ROI 1 @ 55%
Buy2 Pending entry @190
Target 2 @383
ROI 2 @ 101%
Our Unique Features
—————————————————————
1. Follow our 10 signals ….10% equity will increase in your account for sure.
2. We are not Trailing stop! or average the trades.
3. 1% Risk Management Per trade.
4. Risk vs Reward up to 25.
Note Please leave comments for any query.
Disclaimer This is my trading experience, it is not an invite or recommendation to trade.
Best Wishes
PRABHUMAYAKANNAN

ALLCARGO : Weakness indicated by MACDThe MACD showed divergences while the price brokeout from the triangle pattern marked with the green trend lines.
The candlestick patterns showed weak patterns at the new highes and the levels remained unsustainable.
The price below 50 SMA is a concern and looking for support at 200 SMA near to the 0.618 retracement level of 171.
The MACD reading below the zero line and the histogram in red indicating weakness in trend concur with the overall weakness existing at the peaks.

ALLCARGO Triangle Pattern BreakoutNSE:ALLCARGO
Triangle Pattern Breakout
Timeframe: Daily
Date: 18 July 2023
Current Price: 296.90
It can move based on Triangle Pattern target - 340
Disclaimer - This I share just for reference and educational purpose for community. Please do not take trade based on this. For trading or investment please do your analysis.

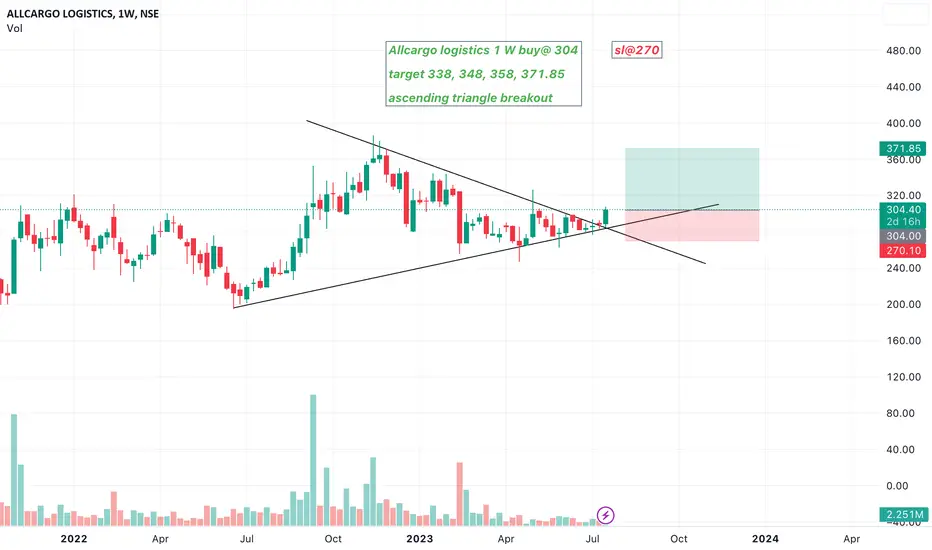
Allcargo logistics 1 W buy@ 304 target 338, 348, 358, 371.85 Allcargo logistics 1 W buy@ 304
target 338, 348, 358, 371.85
ascending triangle breakout
sl@270
AllCargo Logistics - Bullish Flag FormationAllCargo Logistics - Bullish Flag Formation - Long Term view
Entry - 330 - 350
Target - 561.15
Stop loss - 300

ALL CARGO - 30MIN.CHART Ascending triangle pattern on 30 min time frame
Can be traded on breakout or breakdown of levels mentioned..
As buy above 385
Sell below 360
TGT 410 for buy and 330 for sell side
Note: Just an idea not any recommendation to buy or sell the particular stock.

All cargo logistics Good fundamentals and getting in a discounted price as compared to the industry standards. Happy Trading ......

ALLCARGO - Bullish Swing Reversal with VolumesNSE: ALLCARGO is closing with a bullish swing reversal candle supported with volumes.
Today's volumes and candlestick formation indicates strong demand and stock should move to previous swing highs in the coming days.
The stock has been consolidating for the past few days which is indicating demand.
One can look for a 8% to 12% gain on deployed capital in this swing trade.
The view is to be discarded in the event of the stock breaking previous swing low.
#NSEindia #Trading #StockMarketindia #Tradingview #SwingTrade
Disclaimer:
This is for educational purposes only.

Allcargo Breaking Out With VolumeAfter a Good Consolidation, allcargo looks ready for another upmove

Allcargo Logistics analysisALLCARGO LOGISTICS
9EMA - 454.95
20EMA - 438.80
50EMA - 409.60
100EMA - 379.3
200EMA - 344.2
Good ROE(Last 5yrs) - 14%+
EPS has grown from a range of 6 to 42(current)
Strong cash flow
Strong ROCE(26) over the past 5yrs(15)
Improved Book value(148cr) compared to 5yrs back(80cr)
Zero pledged percentage
Recently created a new 52nd week high
Stock P/E(11) vs Industry P/E(25)
This Stocks benefits from lower Crude Oil prices
An undervalued stock which has great potential to grow
Technically Strong Stock
RSI showing strength
Continuation of good volumes for this stock could end up with a new HIGH
Recommended for a buy at CMP or on dips for a target of 490+ with a stop loss of below 455

ALL CARGO 1) Trend line break with volume
2) (use http// before )chartink.com/screener/volume-2022-03-26-4 based on this scanner signal received on 12-11-2022. (volume moving average crossover)
will buy only if it break high of the day 12-11-2022 (ltp- 459)
sl : low of candle 8%
target: 10% initial and trail after every 5% up-move


AllCargo logistics Allcargo logistics CMP 453. Looking good for the target of 581/764. Weak below 370.taking support on 20 EMA and making new high.

ALLCARGONSE:ALLCARGO
WAIT in case of Huge GAP UP !
Note :
1.One Can Go long with a Strict SL below the Trendline or Swing Low of Daily Candle.
2. Close, should be good and Clean.
3. R:R ratio should be 1 :2 minimum
4. Plan as per your RISK appetite
Disclaimer : You are responsible for your Profits and loss, Shared for Educational purpose!
