AMBER | Buy above 6750 | SL below 6100 | Target 9696Disclaimer:
This is not financial advice. Please do your own research or consult with a financial advisor before making any investment decisions. Investments in stocks can be risky and may result in loss of capital.
AMBER trade ideas

AMBER CMP 6100.Last time from same levels we have see a super strong rally.Now also it going ready again for a blast swing move.Add this to your wachlist and see how it perform in coming days.I am not a Sebi Registered Risk is your own.
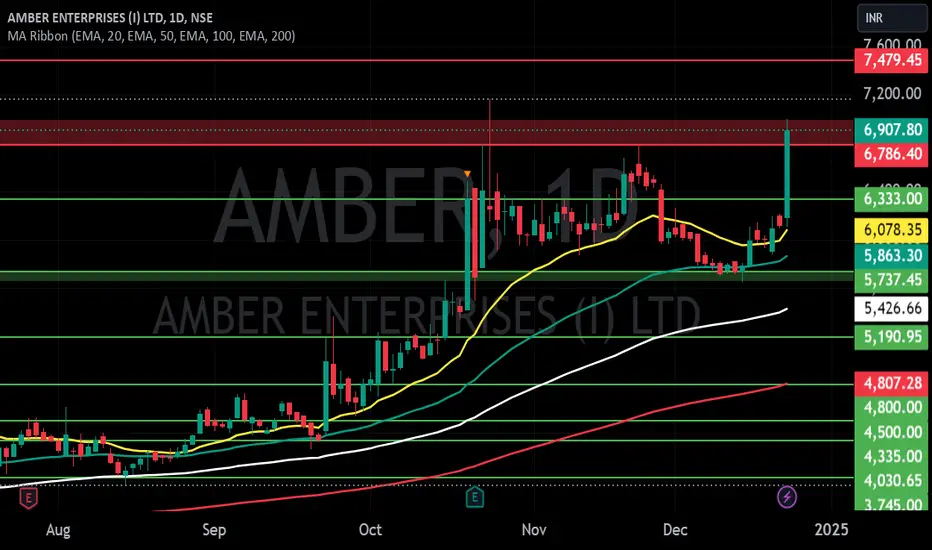
Amber EnterprisesAmer Enterprises
Taken support @ 200 EMA and bounced
RSI above 60 on monthly basis
Daily RSI above 40 now

AMBER - Next multibagger !AMBER Stock Update !!
Stock is at Law of Polarity and support is around 5000-5200
Stock is ready to touch 10000 levels in weeks to come
Thank You !

AMBER ENTERPRISES LTD S/R Support and Resistance Levels:
Support Levels: These are price points (green line/shade) where a downward trend may be halted due to a concentration of buying interest. Imagine them as a safety net where buyers step in, preventing further decline.
Resistance Levels: Conversely, resistance levels (red line/shade) are where upward trends might stall due to increased selling interest. They act like a ceiling where sellers come in to push prices down.
Breakouts:
Bullish Breakout: When the price moves above resistance, it often indicates strong buying interest and the potential for a continued uptrend. Traders may view this as a signal to buy or hold.
Bearish Breakout: When the price falls below support, it can signal strong selling interest and the potential for a continued downtrend. Traders might see this as a cue to sell or avoid buying.
20 EMA (Exponential Moving Average):
Above 20 EMA(50 EMA): If the stock price is above the 20 EMA, it suggests a potential uptrend or bullish momentum.
Below 20 EMA: If the stock price is below the 20 EMA, it indicates a potential downtrend or bearish momentum.
Trendline: A trendline is a straight line drawn on a chart to represent the general direction of a data point set.
Uptrend Line: Drawn by connecting the lows in an upward trend. Indicates that the price is moving higher over time. Acts as a support level, where prices tend to bounce upward.
Downtrend Line: Drawn by connecting the highs in a downward trend. Indicates that the price is moving lower over time. It acts as a resistance level, where prices tend to drop.
Disclaimer:
I am not a SEBI registered. The information provided here is for learning purposes only and should not be interpreted as financial advice. Consider the broader market context and consult with a qualified financial advisor before making investment decisions.


Ready for Breakout...NSE:AMBER trade at 4550. Support is @ 4000 Resistance is @ 4800.
on Daily chart when stock break its resistance level, you can watch it next Resistance @ 6000

Go long in AMber Enterprises only above 7405On daily frame, we have seen that Amber Enterprises have shown a good upside and from last 2-3 trading session it's little bit correct. Now, it has been retraced from the level of 0.5 and we can expect a good move again upside.
Take fresh position in this stock only above 7405, from there we can expect targets of 7445,7530 & 7777.

AMBER ENTERPRISES LTD S/RSupport and Resistance Levels:
Support Levels: These are price points (green line/shade) where a downward trend may be halted due to a concentration of buying interest. Imagine them as a safety net where buyers step in, preventing further decline.
Resistance Levels: Conversely, resistance levels (red line/shade) are where upward trends might stall due to increased selling interest. They act like a ceiling where sellers come in to push prices down.
Breakouts:
Bullish Breakout: When the price moves above resistance, it often indicates strong buying interest and the potential for a continued uptrend. Traders may view this as a signal to buy or hold.
Bearish Breakout: When the price falls below support, it can signal strong selling interest and the potential for a continued downtrend. Traders might see this as a cue to sell or avoid buying.
MA Ribbon (EMA 20, EMA 50, EMA 100, EMA 200) :
Above EMA: If the stock price is above the EMA, it suggests a potential uptrend or bullish momentum.
Below EMA: If the stock price is below the EMA, it indicates a potential downtrend or bearish momentum.
Trendline: A trendline is a straight line drawn on a chart to represent the general direction of a data point set.
Uptrend Line: Drawn by connecting the lows in an upward trend. Indicates that the price is moving higher over time. Acts as a support level, where prices tend to bounce upward.
Downtrend Line: Drawn by connecting the highs in a downward trend. Indicates that the price is moving lower over time. It acts as a resistance level, where prices tend to drop.
Disclaimer:
I am not a SEBI registered. The information provided here is for learning purposes only and should not be interpreted as financial advice. Consider the broader market context and consult with a qualified financial advisor before making investment decisions.
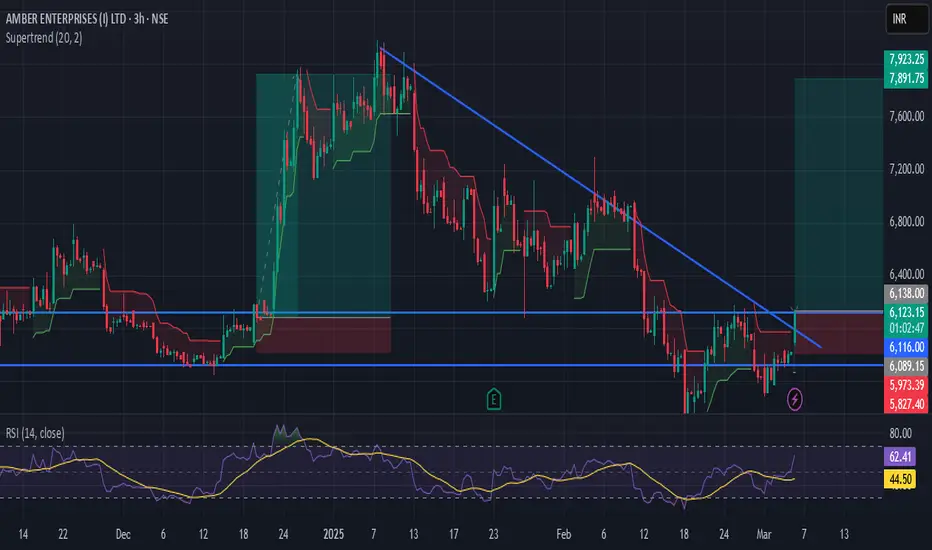
AMBER: Wave 5 Setup in Progress AMBER Enterprises (AMBER): Wave 5 Setup in Progress
Wave Analysis:
The stock is currently in the Wave 4 corrective zone between 5,762 - 5,667 INR, a key support area.
A potential liquidity sweep below 5,667 INR could attract strong buying interest.
Target zones for Wave 5 completion are 6,976 - 7,127 INR.
Key Observations:
Wave Structure: Completion of Waves 1, 2, and 3; Wave 4 is nearing a reversal zone.
Liquidity Sweep Potential: A dip below 5,667 INR might collect stop-loss liquidity before reversing.
Trading Plan:
Entry:
Look for entry near 5,762 - 5,667 INR upon confirmation of reversal (e.g., bullish candle with volume).
Monitor behavior if prices dip below 5,667 INR and recover sharply.
Stop-Loss: Place stop-loss below 5,060 INR (invalidates Wave 4).
Target Levels:
First target: 6,500 INR (partial profit booking).
Final target: 7,000+ INR (completion of Wave 5).
Indicators to Monitor:
RSI for oversold conditions at entry zones.
Volume confirmation during reversal.
Disclaimer: This analysis is for educational purposes only. I am not a SEBI-registered analyst. Please do your own research or consult a financial advisor before trading.


Review and plan for 23rd October 2024Nifty future and banknifty future analysis and intraday plan in kannada.
This video is for information/education purpose only. you are 100% responsible for any actions you take by reading/viewing this post.
please consult your financial advisor before taking any action.
----Vinaykumar hiremath, CMT

SWING IDEA - AMBER ENTERPRISESAmber Enterprises , a leading player in the Indian air conditioning and refrigeration industry, is showing technical signals that suggest a promising swing trading opportunity.
Reasons are listed below :
4600 Resistance Breakout : The 4600 level has been a significant resistance zone. The price is now breaking out above this level, indicating strong bullish momentum.
Strong Bullish Marubozu Candle on Daily and Weekly Timeframes : The recent formation of bullish marubozu candles on both the daily and weekly charts indicates strong buying pressure and suggests potential for further upward movement.
Trading Above 50 and 200 EMA : The stock is trading above both the 50-day and 200-day exponential moving averages (EMA), reinforcing the bullish sentiment and providing strong support levels.
Higher Highs : The stock is consistently making higher highs, indicating a strong upward trend.
Gradual Increase in Volumes : A noticeable increase in trading volumes confirms the strength of the price move and indicates growing investor interest.
Trading at All-Time High : The stock is trading at its all-time high, suggesting strong market confidence and potential for further gains.
DISCLAIMER -
Decisions to buy, sell, hold or trade in securities, commodities and other investments involve risk and are best made based on the advice of qualified financial professionals. Any trading in securities or other investments involves a risk of substantial losses. The practice of "Day Trading" involves particularly high risks and can cause you to lose substantial sums of money. Before undertaking any trading program, you should consult a qualified financial professional. Please consider carefully whether such trading is suitable for you in light of your financial condition and ability to bear financial risks. Under no circumstances shall we be liable for any loss or damage you or anyone else incurs as a result of any trading or investment activity that you or anyone else engages in based on any information or material you receive through TradingView or our services.
@visionary.growth.insights

AMBER ENTERPRISES LTD S/R Support and Resistance Levels:
Support Levels: These are price points (green line/shade) where a downward trend may be halted due to a concentration of buying interest. Imagine them as a safety net where buyers step in, preventing further decline.
Resistance Levels: Conversely, resistance levels (red line/shade) are where upward trends might stall due to increased selling interest. They act like a ceiling where sellers come in to push prices down.
Breakouts:
Bullish Breakout: When the price moves above resistance, it often indicates strong buying interest and the potential for a continued uptrend. Traders may view this as a signal to buy or hold.
Bearish Breakout: When the price falls below support, it can signal strong selling interest and the potential for a continued downtrend. Traders might see this as a cue to sell or avoid buying.
20 EMA (Exponential Moving Average):
Above 20 EMA(50 EMA): If the stock price is above the 20 EMA, it suggests a potential uptrend or bullish momentum.
Below 20 EMA: If the stock price is below the 20 EMA, it indicates a potential downtrend or bearish momentum.
Trendline: A trendline is a straight line drawn on a chart to represent the general direction of a data point set.
Uptrend Line: Drawn by connecting the lows in an upward trend. Indicates that the price is moving higher over time. Acts as a support level, where prices tend to bounce upward.
Downtrend Line: Drawn by connecting the highs in a downward trend. Indicates that the price is moving lower over time. It acts as a resistance level, where prices tend to drop.
RSI: RSI readings greater than the 70 level are overbought territory, and RSI readings lower than the 30 level are considered oversold territory.
Combining RSI with Support and Resistance:
Support Level: This is a price level where a stock tends to find buying interest, preventing it from falling further. If RSI is showing an oversold condition (below 30) and the price is near or at a strong support level, it could be a good buy signal.
Resistance Level: This is a price level where a stock tends to find selling interest, preventing it from rising further. If RSI is showing an overbought condition (above 70) and the price is near or at a strong resistance level, it could be a signal to sell or short the asset.
Disclaimer:
I am not a SEBI registered. The information provided here is for learning purposes only and should not be interpreted as financial advice. Consider the broader market context and consult with a qualified financial advisor before making investment decisions.
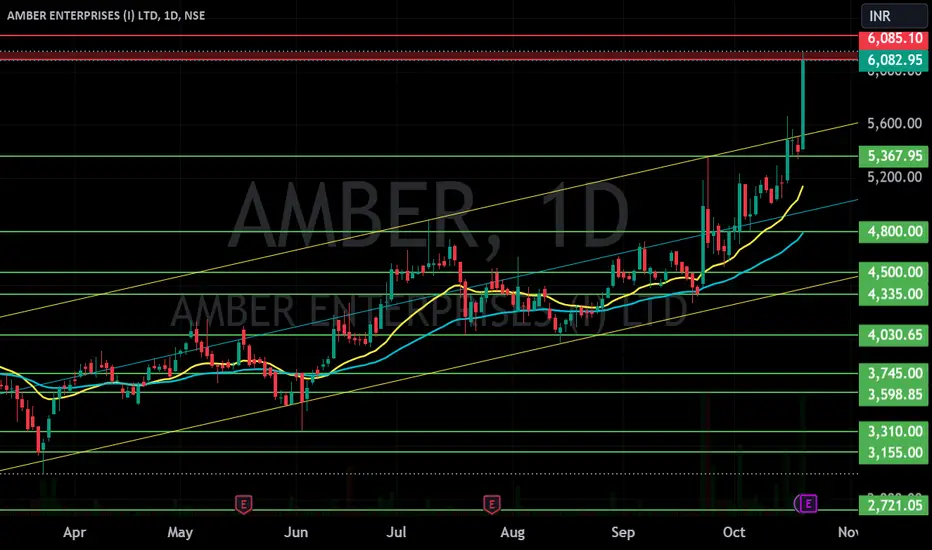
AMBER ENTERPRISES-Weekly Breakout with Strong MomentumBreakout Confirmation: Amber Enterprises has given a decisive breakout above the crucial Fibonacci 23.6% level (₹5,206), with a significant price surge. This breakout was accompanied by heavy volume , indicating strong bullish momentum and participation.
Fibonacci Levels:
The stock retraced from its highs at ₹6,256.7, respecting the Fibonacci levels:
38.2% retracement at ₹4,557.35.
50% retracement at ₹4,032.40.
61.8% retracement at ₹3,507.50, which acted as a strong support before the stock resumed its upward movement.
The breakout above ₹5,206 now opens the path towards the previous highs around ₹6,256.7.
Bullish Trendline Support: The stock has been respecting an ascending triangle pattern, marked by higher lows, which reflects accumulation and strengthening of the uptrend. The recent breakout from this triangle pattern gives further bullish confirmation.
Targets Ahead:
Near-term target : Based on the breakout and the height of the triangle, the immediate target is around ₹6,256, which aligns with the 0% Fibonacci level.
Potential upside projection : Using the measured move from the breakout, the stock has a potential to reach ₹6,900-7,000 levels, reflecting a 30-40% upside from the breakout point.
RSI Momentum : The RSI has broken above the 70-mark, entering the overbought zone, which confirms strong bullish momentum. However, the overbought condition may suggest some consolidation in the short term before the next leg up.
Support Levels : On any pullback, strong support lies around the Fibonacci 38.2% level at ₹4,557.35, followed by ₹4,032.40 (50% level). As long as these supports hold, the overall trend remains bullish.
Conclusion : Amber Enterprises is showing a powerful breakout with high volume, indicating a potential bullish rally in the coming weeks. Traders can look for opportunities on pullbacks or momentum continuation above ₹5,500, with a near-term target of ₹6,256 and a possible extension towards ₹6,900.

AMBER1. Anything can happen.
2. You don't need to know what is going to happen next in order to make money.
3. There is a random distribution between wins and losses for any given set of variables that define an edge. No other thoughts
4. An edge is nothing more than an indication of a higher probability of one thing happening over another.
5. Every moment in the market is unique.

Split entries Protect and safeguard capital.Vishal Baliya is Author of the book: The Happy Candles Way to wealth creation. (Available on Amazon in Paperback and Kindle version)
Split entries Protect capital and reduces losses:
Many times I get the question: What are the best friend of investors?
My answer here would be: Stop losses, trailing stop losses and Split entries.
We will talk about Stop loss and Trailing stop loss in a separate article but today we will talk about Split entries. On the onset let me clarify this is not a call of any company. The chart used below is to explain the process of Split entries in stock market. Breakouts are a great thing. Lot of people make money through breakout trading and lot of people make even more money through breakout investing. But even after selecting a stock after proper due diligence, consulting your financial advisor, reading intrinsically about the company, making charts, studying fundamentals there is a possibility that breakout still might fail. No one can be 100% sure otherwise all investors would be multi Billionaires.
This is because there is inherent risk in investment whether it is equity or any other form of investment. More so in equity as there are many macro and micro economic and factors at play. Some or most are beyond control of even the promoters of the company or mega investors. Thus when you are not 100% sure of a breakout and there are important resistances still at play, you can opt for split entries.
Now have a look at the chart below.
In the chart you can see how this stock took the support of 200 days EMA Father Line after making a bottom near 3311. Zone A to Zone B is the area where we feel that the stock has completed the process of bottom formation and is turning around. Say you want to invest Rs. 21,000 in this company. Your X here is 21000. X/2 = 10,500 and X/3 = 7000 and so on. (X being the money you want to invest in a particular company.) Instead of going all in between zone A and Zone B shown in the chart. You can go X/2 between zone A and B. Why so? Because there is an important hurdle of Mother line at 50 days EMA still to be crossed. Suppose the Mother line acts up and stops the rally and stocks turns bearish your X/2 capital is still intact. To protect remaining X/2 there is a stop loss. In case the stock turns bearish, your Rs. 10,500 is intact. Suppose you have kept stop loss at 10% of your capital deployed. 90% of your X/2 is safe plus 100% of your X/2 capital which you are yet to invest is also safe. Thus Split entry protects your capital. Now ideal scenario in my opinion would be X/2 entry between Zone A and B. Second X/2 entry between zone B and C where you got a breakout confirmation when the stock has confirmed its bullishness as the stock has given a closing above Mother line which is 50 days EMA. To know about the Mother, Father and the Small Child Theory please do read my book: The Happy Candles Way to Wealth Creation which is available on Amazon in paperback and Kindle version. Which explains in depth many such concepts which will help you as an investor.
The argument against such an investment would be: Ah! If I would invest my full capital between Zone A and B. And cruise till Zone D. I will make more money. Definitely you would. But there was a greater risk compared to split entry. Even if you take a split entry between Zone A and B and Second X/2 entry between zone B and C and cruise till Zone D, you will still make a good amount of money. The risk you would have taken in case of split entry would be much less compared to having invested all your capital in one go.
Pyramiding Split Entry Approach:
Another kind of split investment is Pyramiding. In Pyramiding you gradually increase your investment in an equity after every positive breakout. Usually at a price higher than the previous one. Like base of the pyramid is large your first investment is high and gradually decreasing the quantum of investment. I personally use split entry/pyramiding split entry approach in many of my equity related investments.
Disclaimer: There is a chance of biases including confirmation bias, information bias, halo effect and anchoring bias in this write-up. Investment in stocks, derivatives and mutual funds is subject to market risk please consult your investment advisor before taking financial decisions. The data, chart or any other information provided above is for the purpose of analysis and is purely educational in nature. They are not recommendations of any kind. We will not be responsible for Profit or loss due to descision taken based on this article. The names of the stocks or index levels mentioned if any in the article are for the purpose of education and analysis only. Purpose of this article is educational. Please do not consider this as a recommendation of any

Head and Shoulder (Inverted) AMBERAbmer Enterprises has made a perfect inverted head & shoulder pattern.
Break out is any time soon.
Stoploss is far away i.e. 2980 on weekly closing basis.
Targets are as follow:
Target1 = 7500
Target2 = 10500
Target3 = 14000
and much more...
Be patient and stay invested.
Alert: This is not a buy recommendation. Kindly consult your financial advisor for this purpose.

cup and handle pattern .cup and handle pattern barkout price 4,720 Stop loss 4,600. first target 5,000/second target 5,300
third target 5,700. cup and handle chat pattern accuracy 85%

AMBER ENTERPRISES BRAKEOUT - AMBER gives brakeout on Daily chartNSE:AMBER
AMBER gives brake out on daily chart.
I am buying this stock
Near 4250-4300
And follow sl on 3400
My target will be 5300
My risk reward ratio is 1:1.50
Return on capital 20%

Long idea Amber Enterprises#amber
Can go long above 3157 that is a strong resistance and retracement level of the last downtrend. Above that targets will be 3725, 4020. Sl will be 2890.

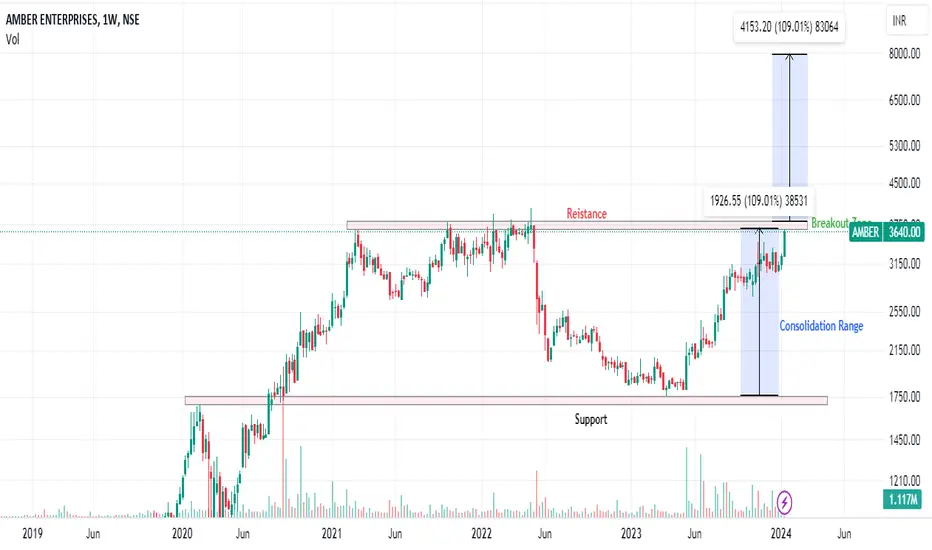
Amber Enterprises India Ltd Chart AnalysisAmber Enterprises is trading near it's long time consolidation breakout zone
Strong Uptrend seen on weekly chart
we can consider this stock above 3800 with sl of 3650 and for target of 4150
Amber Enterprises, Bullish, Kindly do your own studyThis stock is ready for big move.
Monthly price has challenged upper BB
Monthly MACD PCO state and above zero line
Monthly RSI is above 60
Weekly Price has taken support of bollinger band median
Weekly RSI has turned from 60 level
Daily price is near breakout level and ABCDE correction seems to be over.
Daily MACD has given PCO above zero line
Daily RSI is near 60.
