Anand Rathi in BULLISH FLAG What more to explain about the beauty of the Ch(art)
- P Senthil Kumar
Chart Lover
Next report date
—
Report period
—
EPS estimate
—
Revenue estimate
—
38.60 INR
3.00 B INR
9.70 B INR
42.69 M
About ANAND RATHI WEALTH LTD
Sector
Industry
Website
Headquarters
Mumbai
Founded
1995
ISIN
INE463V01026
FIGI
BBG013TG2PP0
Anand Rathi Wealth Ltd. engaged in the distribution and sale of financial products. It offers corporate finance, investment banking, stock broking, and private wealth services. The company was founded on March 22, 1995 and is headquartered in Mumbai, India.
Related stocks

Long ANANDRATHISuperTrend has turned positive on the weekly chart, with the recent closing price trading above the 10 EMA
BUY ANANDRATHI
Entry - 2250
SL - 2015

Amazing breakout on WEEKLY Timeframe - ANANDRATHICheckout an amazing breakout happened in the stock in Weekly timeframe, macroscopically seen in Daily timeframe. Having a great favor that the stock might be bullish expecting a staggering returns of minimum 25% TGT. IMPORTANT BREAKOUT LEVELS ARE ALWAYS RESPECTED!
NOTE for learners: Place the break
Anand Rathi Wealth: Breakout Alert – Long Position Opportunity! ✅ Weekly Breakout Confirmed – Stock breaking key resistance with strong volume.
✅ Bullish Momentum – Sustained uptrend with positive price action.
✅ Support & Resistance – Holding above crucial support, next resistance in sight.
✅ Risk-Reward Favorable – Stop-loss & target levels strategically place

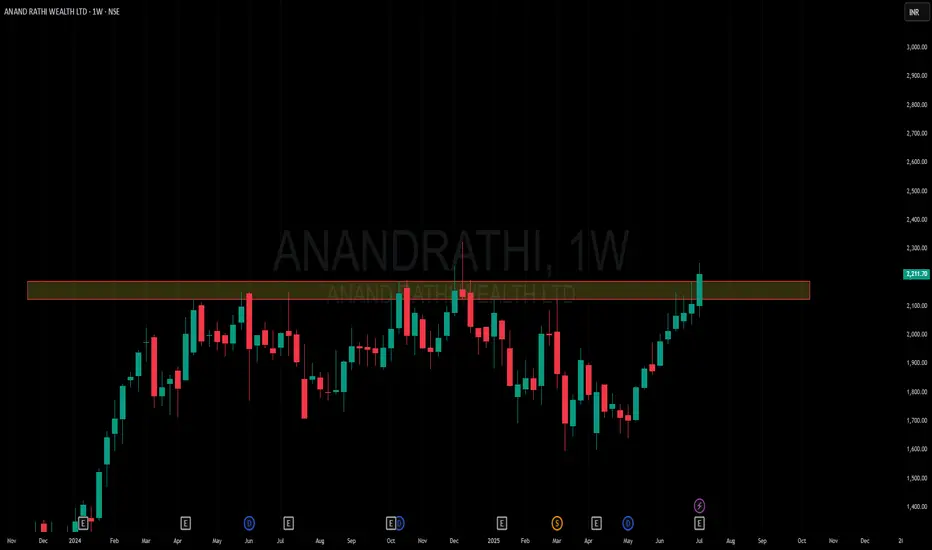
ANANDRATHI - 1Y Range.- The chart is self-explanatory as always.
- The price is respecting the support and resistance
- One-year-long consolidation range
- One of the strongest companies in this domain
- The capital market enablers theme has performed quite well in this bull run.
I would like to keep an eye on this.
Di

A good setup. monthly and weekly RSI above than 60 daily. Rsi taMy favorite strategy all. parameter set. weekly, monthly RSI above 60. and daily RSI taking support on 40. This is the perfect setup for like this valuable stock This is lucky chance and very good for a steady purpose. One can see. profit potential for future

a bull stock after almost an year of consolidation the stock is about to break
it gave breakout but could not sustain it and has now come to support zone
lets wait and enjoy

ANANDRATHI coming out of consolidation ANANDRATHI is coming out of consolidation after long 6 months

ANANDRATHI CMP 4380.After give a strong rally in 2023 stock take rest and consolidating from last one year.And mak a strong range resistance at 4300 levels.On daily timeframe now this range breaking out.On monthly timeframe this looks like Pole and Flag Pattern.Last daily candle volume is very strong and upper bonnilge

Nifty , BankNifty and Tata Motors Update- 20 Nov 2024Hello Traders,
Checkout our latest update on Nifty , BankNifty. Also checkout our previous video updates on Nifty and BankNifty

See all ideas
Summarizing what the indicators are suggesting.
Neutral
SellBuy
Strong sellStrong buy
Strong sellSellNeutralBuyStrong buy
Neutral
SellBuy
Strong sellStrong buy
Strong sellSellNeutralBuyStrong buy
Neutral
SellBuy
Strong sellStrong buy
Strong sellSellNeutralBuyStrong buy
An aggregate view of professional's ratings.
Neutral
SellBuy
Strong sellStrong buy
Strong sellSellNeutralBuyStrong buy
Neutral
SellBuy
Strong sellStrong buy
Strong sellSellNeutralBuyStrong buy
Neutral
SellBuy
Strong sellStrong buy
Strong sellSellNeutralBuyStrong buy
Displays a symbol's price movements over previous years to identify recurring trends.
Frequently Asked Questions
The current price of ANANDRATHI is 2,688.30 INR — it has increased by 1.36% in the past 24 hours. Watch ANAND RATHI WEALTH LTD stock price performance more closely on the chart.
Depending on the exchange, the stock ticker may vary. For instance, on NSE exchange ANAND RATHI WEALTH LTD stocks are traded under the ticker ANANDRATHI.
ANANDRATHI stock has risen by 1.88% compared to the previous week, the month change is a 28.60% rise, over the last year ANAND RATHI WEALTH LTD has showed a 45.55% increase.
We've gathered analysts' opinions on ANAND RATHI WEALTH LTD future price: according to them, ANANDRATHI price has a max estimate of 2,580.00 INR and a min estimate of 1,491.00 INR. Watch ANANDRATHI chart and read a more detailed ANAND RATHI WEALTH LTD stock forecast: see what analysts think of ANAND RATHI WEALTH LTD and suggest that you do with its stocks.
ANANDRATHI reached its all-time high on Jul 23, 2025 with the price of 2,698.20 INR, and its all-time low was 271.00 INR and was reached on Feb 24, 2022. View more price dynamics on ANANDRATHI chart.
See other stocks reaching their highest and lowest prices.
See other stocks reaching their highest and lowest prices.
ANANDRATHI stock is 2.27% volatile and has beta coefficient of 0.43. Track ANAND RATHI WEALTH LTD stock price on the chart and check out the list of the most volatile stocks — is ANAND RATHI WEALTH LTD there?
Today ANAND RATHI WEALTH LTD has the market capitalization of 219.51 B, it has increased by 18.05% over the last week.
Yes, you can track ANAND RATHI WEALTH LTD financials in yearly and quarterly reports right on TradingView.
ANAND RATHI WEALTH LTD is going to release the next earnings report on Oct 9, 2025. Keep track of upcoming events with our Earnings Calendar.
ANAND RATHI WEALTH LTD revenue for the last quarter amounts to 2.79 B INR, despite the estimated figure of 2.45 B INR. In the next quarter, revenue is expected to reach 2.82 B INR.
ANANDRATHI net income for the last quarter is 936.24 M INR, while the quarter before that showed 734.51 M INR of net income which accounts for 27.46% change. Track more ANAND RATHI WEALTH LTD financial stats to get the full picture.
ANAND RATHI WEALTH LTD dividend yield was 0.55% in 2024, and payout ratio reached 29.13%. The year before the numbers were 0.38% and 25.98% correspondingly. See high-dividend stocks and find more opportunities for your portfolio.
As of Jul 29, 2025, the company has 1.16 K employees. See our rating of the largest employees — is ANAND RATHI WEALTH LTD on this list?
EBITDA measures a company's operating performance, its growth signifies an improvement in the efficiency of a company. ANAND RATHI WEALTH LTD EBITDA is 4.60 B INR, and current EBITDA margin is 45.35%. See more stats in ANAND RATHI WEALTH LTD financial statements.
Like other stocks, ANANDRATHI shares are traded on stock exchanges, e.g. Nasdaq, Nyse, Euronext, and the easiest way to buy them is through an online stock broker. To do this, you need to open an account and follow a broker's procedures, then start trading. You can trade ANAND RATHI WEALTH LTD stock right from TradingView charts — choose your broker and connect to your account.
Investing in stocks requires a comprehensive research: you should carefully study all the available data, e.g. company's financials, related news, and its technical analysis. So ANAND RATHI WEALTH LTD technincal analysis shows the strong buy rating today, and its 1 week rating is buy. Since market conditions are prone to changes, it's worth looking a bit further into the future — according to the 1 month rating ANAND RATHI WEALTH LTD stock shows the strong buy signal. See more of ANAND RATHI WEALTH LTD technicals for a more comprehensive analysis.
If you're still not sure, try looking for inspiration in our curated watchlists.
If you're still not sure, try looking for inspiration in our curated watchlists.