Anand Rathi in BULLISH FLAG What more to explain about the beauty of the Ch(art)
- P Senthil Kumar
Chart Lover
ANANDRATHI trade ideas

Long ANANDRATHISuperTrend has turned positive on the weekly chart, with the recent closing price trading above the 10 EMA
BUY ANANDRATHI
Entry - 2250
SL - 2015

Amazing breakout on WEEKLY Timeframe - ANANDRATHICheckout an amazing breakout happened in the stock in Weekly timeframe, macroscopically seen in Daily timeframe. Having a great favor that the stock might be bullish expecting a staggering returns of minimum 25% TGT. IMPORTANT BREAKOUT LEVELS ARE ALWAYS RESPECTED!
NOTE for learners: Place the breakout levels as per the chart shared and track it yourself to get amazed!!
#No complicated chart patterns
#No big big indicators
#No Excel sheet or number magics
TRADE IDEA: WAIT FOR THE STOCK TO BREAKOUT IN WEEKLY TIMEFRAME ABOVE THIS LEVEL.
Checkout an amazing breakout happened in the stock in Weekly timeframe.
Breakouts happening in longer timeframe is way more powerful than the breakouts seen in Daily timeframe. You can blindly invest once the weekly candle closes above the breakout line and stay invested forever. Also these stocks breakouts are lifelong predictions, it means technically these breakouts happen giving more returns in the longer runs. Hence, even when the scrip makes a loss of 10% / 20% / 30% / 50%, the stock will regain and turn around. Once they again enter the same breakout level, they will flyyyyyyyyyyyy like a ROCKET if held in the portfolio in the longer run.
Time makes money, GREEDY & EGO will not make money.
Also, magically these breakouts tend to prove that the companies turn around and fundamentally becoming strong. Also the magic happens when more diversification is done in various sectors under various scripts with equal money invested in each N500 scripts.
The real deal is when to purchase and where to purchase the stock. That is where Breakout study comes into play.
Check this stock which has made an all time low and high chances that it makes a "V" shaped recovery.
> Taking support at last years support or breakout level
> High chances that it reverses from this point.
> Volume dried up badly in last few months / days.
> Very high suspicion based analysis and not based on chart patterns / candle patterns deeply.
> VALUABLE STOCK AVAILABLE AT A DISCOUNTED PRICE
> OPPURTUNITY TO ACCUMULATE ADEQUATE QUANTITY
> MARKET AFTER A CORRECTION / PANIC FALL TO MAKE GOOD INVESTMENT
DISCLAIMER : This is just for educational purpose. This type of analysis is equivalent to catching a falling knife. If you are a warrior, you throw all the knives back else you will be sorrow if it hits SL. Make sure to do your analysis well. This type of analysis only suits high risks investor and whose is willing to throw all the knives above irrespective of any sectoral rotation. BE VERY CAUTIOUS AS IT IS EXTREME BOTTOM FISHING.
HOWEVER, THIS IS HOW MULTIBAGGERS ARE CAUGHT !
STOCK IS AT RIGHT PE / RIGHT EVALUATION / MORE ROAD TO GROW / CORRECTED IV / EXCELLENT BOOKS / USING MARKET CRASH AS AN OPPURTUNITY / EPS AT SKY.
LET'S PUMP IN SOME MONEY AND REVOLUTIONIZE THE NATION'S ECONOMY!
Anand Rathi Wealth: Breakout Alert – Long Position Opportunity! ✅ Weekly Breakout Confirmed – Stock breaking key resistance with strong volume.
✅ Bullish Momentum – Sustained uptrend with positive price action.
✅ Support & Resistance – Holding above crucial support, next resistance in sight.
✅ Risk-Reward Favorable – Stop-loss & target levels strategically placed.
📈 Ideal for positional traders looking for a strong breakout setup! 🚀

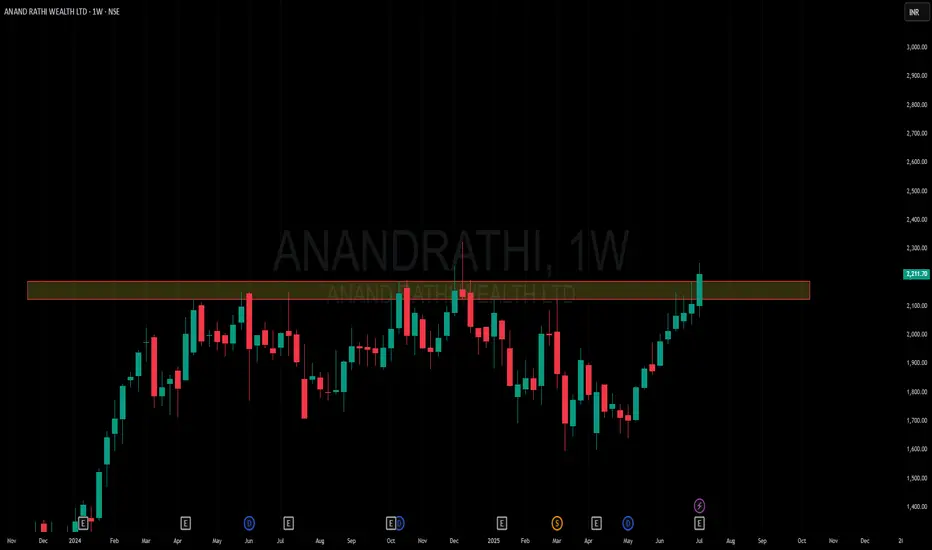
ANANDRATHI - 1Y Range.- The chart is self-explanatory as always.
- The price is respecting the support and resistance
- One-year-long consolidation range
- One of the strongest companies in this domain
- The capital market enablers theme has performed quite well in this bull run.
I would like to keep an eye on this.
Disclaimer: This analysis is purely for educational purposes and does not constitute trading advice. I am not a SEBI-registered advisor, and trading involves significant risk. Please consult with a financial advisor before making any investment decisions.

A good setup. monthly and weekly RSI above than 60 daily. Rsi taMy favorite strategy all. parameter set. weekly, monthly RSI above 60. and daily RSI taking support on 40. This is the perfect setup for like this valuable stock This is lucky chance and very good for a steady purpose. One can see. profit potential for future

a bull stock after almost an year of consolidation the stock is about to break
it gave breakout but could not sustain it and has now come to support zone
lets wait and enjoy

ANANDRATHI coming out of consolidation ANANDRATHI is coming out of consolidation after long 6 months

ANANDRATHI CMP 4380.After give a strong rally in 2023 stock take rest and consolidating from last one year.And mak a strong range resistance at 4300 levels.On daily timeframe now this range breaking out.On monthly timeframe this looks like Pole and Flag Pattern.Last daily candle volume is very strong and upper bonnilger band breaked out that be a good sign for a Uptrend in coming days.Possible make a new high.Wait and wach and study your own before any entry.Thanks for support.

Nifty , BankNifty and Tata Motors Update- 20 Nov 2024Hello Traders,
Checkout our latest update on Nifty , BankNifty. Also checkout our previous video updates on Nifty and BankNifty

SWING IDEA - ANAND RATHI WEALTH LTDAnand Rathi Wealth Ltd , a leading wealth management company in India offering financial advisory services, is presenting a potential swing trading opportunity.
Reasons are listed below:
4300 Zone Breakout : The 4300 level has been tested multiple times, and the stock is now breaking out, suggesting renewed buying interest.
Bullish Engulfing Candle on Daily Timeframe : A bullish engulfing pattern has formed on the daily chart, indicating strong upward momentum.
Breaking Consolidation Zone of 6 Months : The stock is breaking out of a long consolidation phase, which could lead to a new bullish trend.
Trading Above 50 and 200 EMA : The price is trading above both the 50 and 200-day exponential moving averages, reinforcing the bullish outlook.
Volume Spike : An increase in trading volumes supports the strength of the breakout, indicating robust market participation.
Target - 4850
Stoploss - daily close below 3990
DISCLAIMER -
Decisions to buy, sell, hold or trade in securities, commodities and other investments involve risk and are best made based on the advice of qualified financial professionals. Any trading in securities or other investments involves a risk of substantial losses. The practice of "Day Trading" involves particularly high risks and can cause you to lose substantial sums of money. Before undertaking any trading program, you should consult a qualified financial professional. Please consider carefully whether such trading is suitable for you in light of your financial condition and ability to bear financial risks. Under no circumstances shall we be liable for any loss or damage you or anyone else incurs as a result of any trading or investment activity that you or anyone else engages in based on any information or material you receive through TradingView or our services.
@visionary.growth.insights

ANAND RATHI WEALTHBreakout happend in this stock with rising 200dma and RS indicator is also showing strength.
Keep your risk and reward ratios according to your own preferance.
This is for educational purpose, do your own research before investing.

Anand Rathi Near breakout Stock is about to breakout. Breakout will confirm if sustained above 301.
Stock has shown good momentum with volumn.

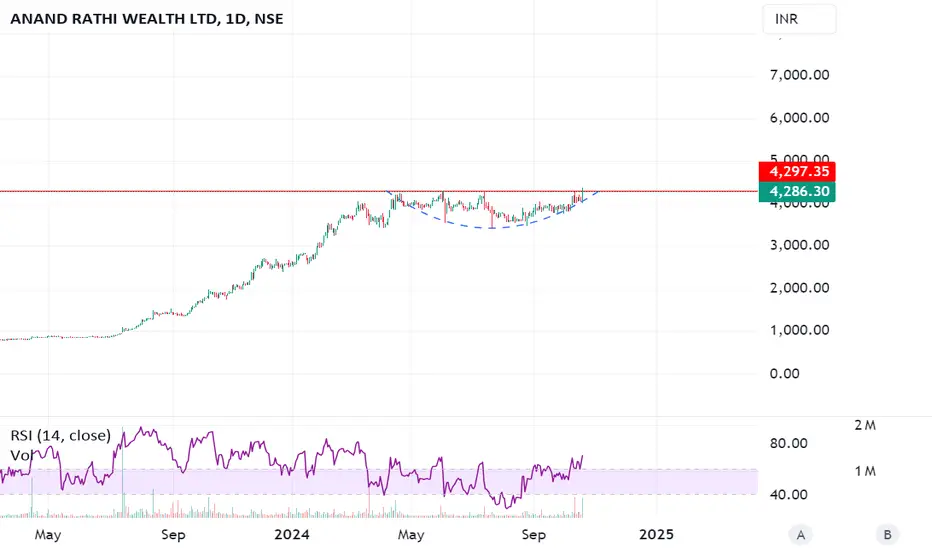
Anand Rathi Wealth Ltd Positional Trade Anand Rathi Wealth Ltd is showing a bullish setup with a cup formation on the daily chart. The price has recently broken above a crucial resistance level of 4,286, indicating strong buying interest. With the RSI climbing towards 70, momentum supports further upside potential. A sustained move above 4,297 could propel the stock to higher levels, targeting 4,500 or more in the near term. Stop-loss can be placed below 4,000 for risk management. This setup offers a favorable risk-to-reward ratio for positional traders.

Anand Rathi Wealth Ltd Positional Trade Anand Rathi Wealth Ltd is showing a bullish setup with a cup formation on the daily chart. The price has recently broken above a crucial resistance level of 4,286, indicating strong buying interest. With the RSI climbing towards 70, momentum supports further upside potential. A sustained move above 4,297 could propel the stock to higher levels, targeting 4,500 or more in the near term. Stop-loss can be placed below 4,000 for risk management. This setup offers a favorable risk-to-reward ratio for positional traders.
Anand Rathi Wealth LtdAnand Rathi chart is looking strong on daily and weekly both time frames . we can consider this stock at current market price.


Bull Penant On Weekly ChartForming A Bull Pennant, can consider buying if breaks out, forming new highs

Daily Time Frame - Anand Rathi Wealth The Structure looks good to us, waiting for this instrument to correct and then give us these opportunities as shown on this instrument (Price Chart).
Note: Its my view only and its for educational purpose only. Only who has got knowledge about this strategy, will understand what to be done on this setup. its purely based on my technical analysis only (strategies). we don't focus on the short term moves, we look for only for Bullish or Bearish Impulsive moves on the setups after a good price action is formed as per the strategy. we never get into corrective moves. because it will test our patience and also it will be a bullish or a bearish trap. and try trade the big moves.
we do not get into bullish or bearish traps. We anticipate and get into only big bullish or bearish moves (Impulsive Moves). Just ride the Bullish or Bearish Impulsive Move. Learn & Know the Complete Market Cycle.
Buy Low and Sell High Concept. Buy at Cheaper Price and Sell at Expensive Price.
Keep it simple, keep it Unique.
please keep your comments useful & respectful.
Thanks for your support....
Tradelikemee Academy


Good momentum breakout Anand rathi wealth management Anand rathi wealth management Ltd
Good for a momentum trade
Buy above 714
Sl 630
Tgt 770 820 880
Ask your financial advisor before taking any action based on my view
Only for educational purposes
Intraday tgt 745 for 17 oct 2022
Buying range 690-625


Anand Rathi Wealth Ltd Getting ready for a breakoutCurrently trading at 653.90
Prices consolidating above 600 levels since April 2022.
Sustaining 600 levels, it could move towards 700 to 800 levels in the coming months.
