ANUP | Buy @2645 | Strict SL below 2528 | Target 3340Disclaimer:
This is not financial advice. Please do your own research or consult with a financial advisor before making any investment decisions. Investments in stocks can be risky and may result in loss of capital.
ANUP trade ideas

Anup Engg📈 Trade Plan:
Entry-1: ₹2408
Stop Loss: ₹2308
Risk: ₹100
Reward: ₹3017
Target: ₹5425
Risk:Reward (RR): 30.2 — extremely favorable if it plays out
Last High: ₹3859
Last Low: ₹2293
Point Variance: 1566
✅ Interpretation & Insights:
Trend Confirmation Across All Timeframes:
Every timeframe from yearly down to intraday (60M) shows an uptrend, indicating strong bullish momentum and confirmation across multiple investor classes.
Demand Zone Clustering:
The demand cluster around 2288–2408 is repeated across MTF & ITF zones. This tight range is a strong accumulation zone.
You are entering right at the upper edge of the demand, which is okay, but better RR existed slightly lower.
Trade Setup:
Entry: ₹2408 is aligned with the weekly/monthly proximal zone.
SL: ₹2308 is just below the demand zone, which is valid technically.
Target: ₹5425 seems based on projection logic (perhaps supply zone or fib extensions). It’s aggressive, but technically aligned with the broader HTF trend.
Risk-Reward:
RR of 30.2 is theoretically excellent, but practically it suggests your SL is very tight compared to the move expected. Monitor volatility closely.
🧠 Strategic Suggestions:
If price consolidates above ₹2408 and shows strength, consider pyramiding.
Watch for daily close above ₹2408 to confirm institutional interest.
Trail SL aggressively once above ₹3000 to protect profit.
🔍 Multi-Timeframe (MTF) Trend Summary:
Timeframe Trend Demand Zone (Proximal–Distal) Avg
Yearly UP 1459 – 1236 1348
Half-Yearly UP 2160 – 1665 1913
Quarterly UP 2160 – 1665 1913
HTF Avg UP 1926 – 1522 1724
| Monthly | UP | 2408 – 2125 | 2267 |
| Weekly | UP | 2408 – 2125 | 2267 |
| Daily | UP | 2395 – 2288 | 2342 |
| MTF Avg | UP | 2404 – 2179 | 2292 |
| 240M | UP | 2395 – 2288 | 2342 |
| 180M | UP | 2395 – 2288 | 2342 |
| 60M | UP | 2337 – 2308 | 2323 |
| ITF Avg | UP | 2376 – 2295 | 2335 |
Buy The Anup Engineering Short Term Trading Advice by Goodluck Capital
Buy The Anup Engineering
Buy Range- 3530 - 3630
Target- 3850 - 3900
StopLoss- below 3330
Potential Return- 8-9%
Approx trade duration 12 - 14 days

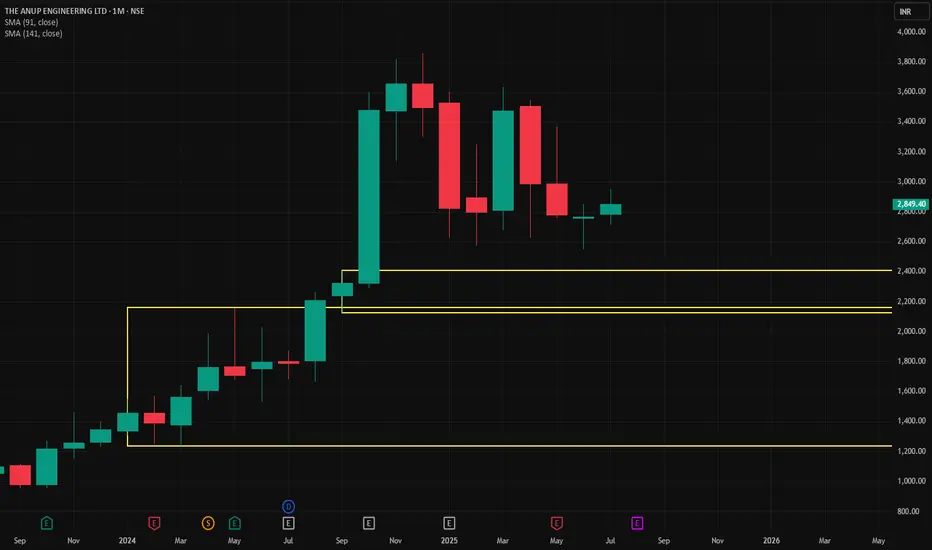
THE ANUP ENGINEERING LTD S/R Support and Resistance Levels:
Support Levels: These are price points (green line/shade) where a downward trend may be halted due to a concentration of buying interest. Imagine them as a safety net where buyers step in, preventing further decline.
Resistance Levels: Conversely, resistance levels (red line/shade) are where upward trends might stall due to increased selling interest. They act like a ceiling where sellers come in to push prices down.
Breakouts:
Bullish Breakout: When the price moves above resistance, it often indicates strong buying interest and the potential for a continued uptrend. Traders may view this as a signal to buy or hold.
Bearish Breakout: When the price falls below support, it can signal strong selling interest and the potential for a continued downtrend. Traders might see this as a cue to sell or avoid buying.
MA Ribbon (EMA 20, EMA 50, EMA 100, EMA 200) :
Above EMA: If the stock price is above the EMA, it suggests a potential uptrend or bullish momentum.
Below EMA: If the stock price is below the EMA, it indicates a potential downtrend or bearish momentum.
Trendline: A trendline is a straight line drawn on a chart to represent the general direction of a data point set.
Uptrend Line: Drawn by connecting the lows in an upward trend. Indicates that the price is moving higher over time. Acts as a support level, where prices tend to bounce upward.
Downtrend Line: Drawn by connecting the highs in a downward trend. Indicates that the price is moving lower over time. It acts as a resistance level, where prices tend to drop.
Disclaimer:
I am not a SEBI registered. The information provided here is for learning purposes only and should not be interpreted as financial advice. Consider the broader market context and consult with a qualified financial advisor before making investment decisions.

The Anup Engineering Ltd.*The Anup Engineering Ltd*
P&F; Formation on Weekly Basis.
Strong Price BreakOut & Sustained.
Vol. Consolidation & Continued BuiltUp.
RSI: 1H >D M
*Trail SL with Upside*
*Book Profit as per Risk Appetite "
Do Your Own Research as well. This is an Opinion.
Happy Investing 😇

ANUP may trade at the mentioned targetsSupport and resistance levels are mentioned on the chart.
Always calculate your risk and don’t forget the importance of STOP LOSS.

The Ultimate Rider #SuperchartzKey levels:
Support: 2100
Resistance: 2300 2700 3000
Write-up:
Breakout trading:
1. **Identifying New Trends:** Breakout trading helps traders identify the beginning of new trends by focusing on price levels where an asset breaks out of its historical trading range.
2. **Volatility Indicator:** Breakouts often occur when there's increased volatility in the market. Monitoring breakouts can provide insights into shifts in market sentiment and potential price movements.
3. **Entry Points:** Breakout points serve as potential entry points for traders looking to ride the momentum of a newly established trend. Buying on a breakout can capture the early stages of a price movement.
4. **Confirmation of Strength:** Successful breakouts indicate the strength of a trend. If an asset breaks out with high volume and follows through with sustained price movement, it suggests a strong trend in that direction.
5. **Avoiding False Signals:** Breakout strategies often include using indicators or confirmation signals to avoid false breakouts. This can enhance the accuracy of trade decisions.
6. **Defined Risk and Reward:** Breakout trading allows for setting clear stop-loss levels below the breakout point, which helps manage risk. Traders can also calculate potential profits based on the distance between the breakout point and a projected target.
7. **Adaptable to Various Markets:** Breakout trading can be applied to various markets, including stocks, forex, commodities, and cryptocurrencies. The concept remains consistent across different assets.
8. **Flexibility:** Traders can adapt breakout strategies to their preferred timeframes, whether they are day traders, swing traders, or long-term investors.
9. **Liquidity Opportunities:** Breakout points are often associated with increased trading volume, which can provide better liquidity for executing trades.
10. **Risk vs. Reward Assessment:** Traders can evaluate the potential risk of a trade (stop-loss) against the potential reward (target price), aiding in decision-making and portfolio management.
11. **Psychological Advantage:** Successful breakout trades can boost a trader's confidence and discipline, reinforcing the effectiveness of their strategy.
12. **Market Events:** Breakouts can occur around significant market events such as earnings reports, economic data releases, or geopolitical developments, offering traders opportunities to capitalize on sudden price movements.
Remember, while breakout trading offers potential advantages, it also carries risks. False breakouts and market reversals can lead to losses. Successful implementation requires a solid understanding of technical analysis, risk management, and the ability to adapt to changing market conditions.

Trendline BreakoutPlease look into the chart for a detailed understanding.
Consider these for short-term & swing trades with 2% profit.
For BTST trades consider booking
target for 1% - 2%
For long-term trades look out for resistance drawn above closing.
Please consider these ideas for educational purpose

Cup and Handle , All time high breakout Anup EngineeringHi,
This script is making all time high. It is also forming patterns inside pattern. That is inverse head and shoulder inside Cup and handle formation. Whenever there is this scenario where we find nested patterns, it adds more confidence in the script and probability of upmove increases.
Based on the uptrending channel formed and Height of cup in cup and handle formation pattern, targets in range of 2000 to 2500 are visible. Kindly check the risk reward and consider this idea for learning purpose :)

Anup heading towards All time highAnup is heading towards All Time High.
Stoploss would be 795 weekly closing basis.

anup buyprice is forming hh, hl structre.
currently breaking the swing high.
considering it a good bet

THE ANUP ENGINEERINGHello,
The ANUP ENGINEERING ltd. has given a rounding bottom pattern breakout in the daily time frame.
It can be accumulated between 962 to 914 for a 1st target and the 2nd target of 1111 and 1280 with a stop loss of 830.

ANUP NSE Anup Engineering BULLISHVIEW ABOVE 1090 CMP 1127ANUP NSE Anup Engineering is bullish if 1090 holds. Ner LifeTime High. Positive Trend. Fresh Breakout.
***** Educational purpose only. Not Buy/Sell Recommendtion.

looks good above 986 for 5% upword movementShowing heavy bullish momentum and breaking the 986 thresholds could make another upward movement of 5-7 %


interesting new kid in the blockphase b seems full of positive cause building...
might be an accumulation, looking at the size of the automatic reaction post selling climax..
should go back down to test supply further
disclaimer... not an investing/trading recommendation
