Anupam Rasayan Ltd view for Intraday 27th May #ANURAS Anupam Rasayan Ltd view for Intraday 27th May #ANURAS
Resistance 875 Watching above 876 for upside momentum.
Support area 860 Below 870 ignoring upside momentum for intraday
Watching below 858 for downside movement...
Above 870 ignoring downside move for intraday
Charts for Educational purposes
Next report date
—
Report period
—
EPS estimate
—
Revenue estimate
—
8.50 INR
933.49 M INR
14.37 B INR
17.26 M
About ANUPAM RASAYAN INDIA LTD
Sector
Industry
CEO
Gopal Agrawal
Website
Headquarters
Surat
Founded
1984
ISIN
INE930P01018
FIGI
BBG00ZKT3HZ7
Anupam Rasayan India Ltd. manufactures pharmaceutical and specialty chemical products. It operates in life science related specialty chemicals and other specialty chemicals segments. The life science related specialty chemicals segment manufactures a variety of life science related specialty chemicals comprising products related to agrochemicals, personal care and pharmaceuticals. it manufactures agro intermediates and agro active ingredients for the agrochemicals industry which are used in the manufacturing of, amongst others, insecticides, fungicides and herbicides. The other specialty chemicals segment manufactures specialty chemicals which are used in diverse end-user segments, comprising specialty pigments, specialty dyes and polymer additives. The company was founded in 1984 and headquartered in Surat, India.
Related stocks

Anupam Rasayan Ltd view for Intraday 27th May #ANURAS Anupam Rasayan Ltd view for Intraday 27th May #ANURAS
Resistance 1000 Watching above 1002 for upside momentum.
Support area 980 Below 990 ignoring upside momentum for intraday
Watching below 978 for downside movement...
Above 990 ignoring downside move for intraday
Charts for Educational purpos

ANURAS CMP 790 (Positional with Stoploss)This stock trading at very important zone if sustain above level we can see a Rocket move in coming days.Add to your watchlist and see how it perform in coming days.
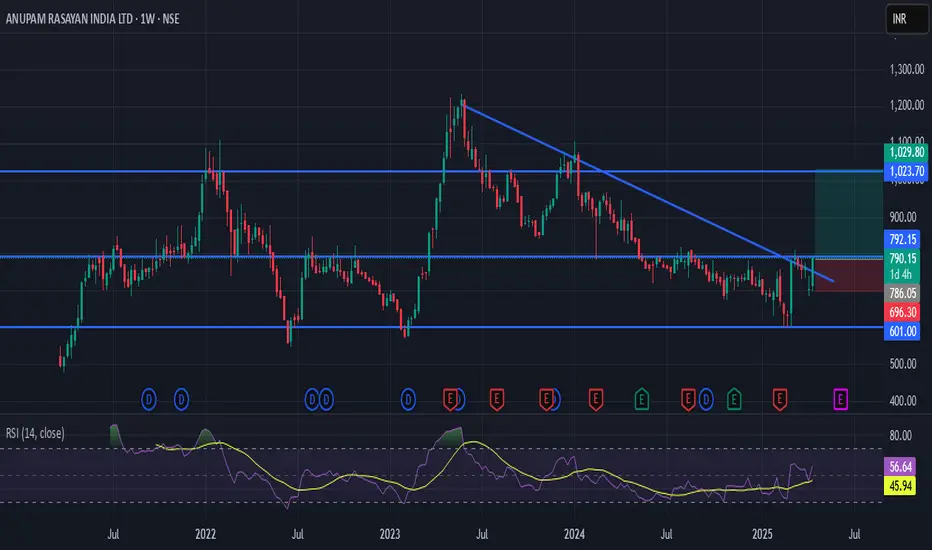
YE Chart Kuch Kehta Hai : ANURAS : Anupam RasayanThe chart presents a textbook breakout setup, exhibiting a classic cup formation with a low-risk entry point. Key observations include:
Channel Breakout Level: The price has decisively broken out above the channel resistance at ₹810, confirming bullish momentum.
Fibonacci Retracement : Using the

ANURAS | Buy @LTP | Strict SL 590 | 1st Target 1000, 2nd 1200Disclaimer:
This is not financial advice. Please do your own research or consult with a financial advisor before making any investment decisions. Investments in stocks can be risky and may result in loss of capital.

#ANURAS: Target 799 in 2-3 Weeks, Reversal from support#ANURAS: Target 799 in 2-3 Weeks, Strong Reversal from support

Anupam Rasayan - Turnaround after a big healthy consolidationThe company has completed a good capex cycle.
Accumulation clearly seen in the charts.
Will pick up momentum once the Chemical Stocks break out.
CMP - 745
Target - 950
SL DCB - 720

MOVING AVERAGE CROSSOVERStock - ANURAS
Entry price - 805
Stop loss price - 772
Sl rupees - 33
Position size(no of share) - 7
Investment of capital( 6098)
Target
1:02-----871
1:03-----904
IF YOU CAPITAL 50K
FOLLOW THIS
MAX LOSS 250RS 0.5%N OF CAPITAL

Double Bottom Breakout - Crossover - ANURAS📊 Script: ANURAS
📊 Sector: Chemicals
📊 Industry: Chemicals
Key highlights: 💡⚡
📈 Script is trading at upper band of BB.
📈 MACD and Double Moving Averages are giving crossover .
📈 Right now RSI is around 66.
📈 Script is giving Double Bottom Breakout on daily chart.
📈 One can go for Swing Trade

ANURAS - What are you up to?I can see 16% move from the price 796. Let's wait and watch this stock reaction on budget day.

See all ideas
Summarizing what the indicators are suggesting.
Neutral
SellBuy
Strong sellStrong buy
Strong sellSellNeutralBuyStrong buy
Neutral
SellBuy
Strong sellStrong buy
Strong sellSellNeutralBuyStrong buy
Neutral
SellBuy
Strong sellStrong buy
Strong sellSellNeutralBuyStrong buy
An aggregate view of professional's ratings.
Neutral
SellBuy
Strong sellStrong buy
Strong sellSellNeutralBuyStrong buy
Neutral
SellBuy
Strong sellStrong buy
Strong sellSellNeutralBuyStrong buy
Neutral
SellBuy
Strong sellStrong buy
Strong sellSellNeutralBuyStrong buy
Displays a symbol's price movements over previous years to identify recurring trends.
Frequently Asked Questions
The current price of ANURAS is 1,136.60 INR — it has increased by 0.28% in the past 24 hours. Watch ANUPAM RASAYAN INDIA LTD stock price performance more closely on the chart.
Depending on the exchange, the stock ticker may vary. For instance, on NSE exchange ANUPAM RASAYAN INDIA LTD stocks are traded under the ticker ANURAS.
ANURAS stock has fallen by −0.31% compared to the previous week, the month change is a −0.99% fall, over the last year ANUPAM RASAYAN INDIA LTD has showed a 44.53% increase.
We've gathered analysts' opinions on ANUPAM RASAYAN INDIA LTD future price: according to them, ANURAS price has a max estimate of 1,305.00 INR and a min estimate of 520.00 INR. Watch ANURAS chart and read a more detailed ANUPAM RASAYAN INDIA LTD stock forecast: see what analysts think of ANUPAM RASAYAN INDIA LTD and suggest that you do with its stocks.
ANURAS reached its all-time high on May 25, 2023 with the price of 1,234.00 INR, and its all-time low was 474.00 INR and was reached on Mar 31, 2021. View more price dynamics on ANURAS chart.
See other stocks reaching their highest and lowest prices.
See other stocks reaching their highest and lowest prices.
ANURAS stock is 1.96% volatile and has beta coefficient of 0.94. Track ANUPAM RASAYAN INDIA LTD stock price on the chart and check out the list of the most volatile stocks — is ANUPAM RASAYAN INDIA LTD there?
Today ANUPAM RASAYAN INDIA LTD has the market capitalization of 125.12 B, it has increased by 1.16% over the last week.
Yes, you can track ANUPAM RASAYAN INDIA LTD financials in yearly and quarterly reports right on TradingView.
ANUPAM RASAYAN INDIA LTD is going to release the next earnings report on Aug 4, 2025. Keep track of upcoming events with our Earnings Calendar.
ANURAS earnings for the last quarter are 3.50 INR per share, whereas the estimation was 3.23 INR resulting in a 8.25% surprise. The estimated earnings for the next quarter are 2.55 INR per share. See more details about ANUPAM RASAYAN INDIA LTD earnings.
ANUPAM RASAYAN INDIA LTD revenue for the last quarter amounts to 3.31 B INR, despite the estimated figure of 3.99 B INR. In the next quarter, revenue is expected to reach 3.11 B INR.
ANURAS net income for the last quarter is 445.67 M INR, while the quarter before that showed 281.92 M INR of net income which accounts for 58.08% change. Track more ANUPAM RASAYAN INDIA LTD financial stats to get the full picture.
EBITDA measures a company's operating performance, its growth signifies an improvement in the efficiency of a company. ANUPAM RASAYAN INDIA LTD EBITDA is 4.02 B INR, and current EBITDA margin is 27.90%. See more stats in ANUPAM RASAYAN INDIA LTD financial statements.
Like other stocks, ANURAS shares are traded on stock exchanges, e.g. Nasdaq, Nyse, Euronext, and the easiest way to buy them is through an online stock broker. To do this, you need to open an account and follow a broker's procedures, then start trading. You can trade ANUPAM RASAYAN INDIA LTD stock right from TradingView charts — choose your broker and connect to your account.
Investing in stocks requires a comprehensive research: you should carefully study all the available data, e.g. company's financials, related news, and its technical analysis. So ANUPAM RASAYAN INDIA LTD technincal analysis shows the neutral today, and its 1 week rating is buy. Since market conditions are prone to changes, it's worth looking a bit further into the future — according to the 1 month rating ANUPAM RASAYAN INDIA LTD stock shows the buy signal. See more of ANUPAM RASAYAN INDIA LTD technicals for a more comprehensive analysis.
If you're still not sure, try looking for inspiration in our curated watchlists.
If you're still not sure, try looking for inspiration in our curated watchlists.