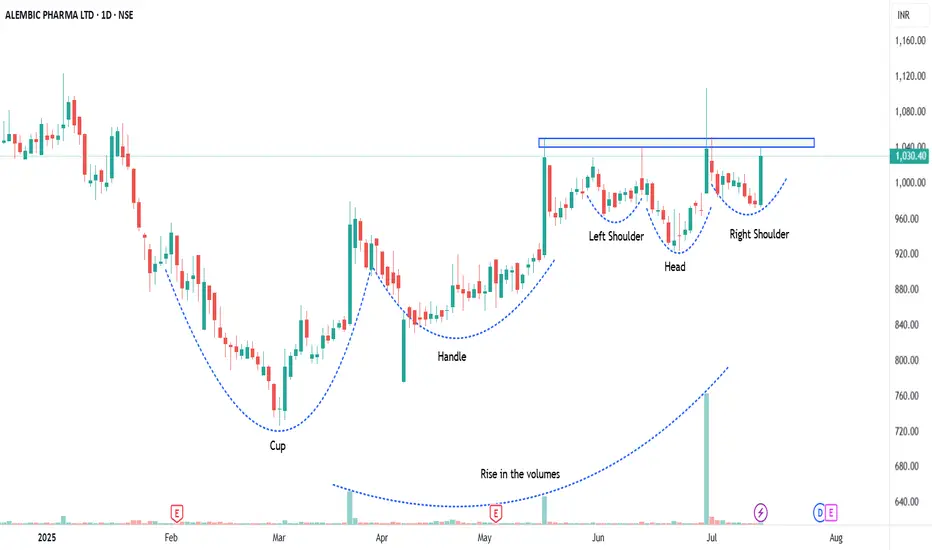
APLLTD - Head & Shoulder patternAll details are given on chart for educational purpose only. If you like the analyses please do share it with your friends, like and follow me for more such interesting charts.
Disc - Am not a SEBI registered analyst. Please do your own analyses before taking position. Details provided on chart is only for educational purposes and not a trading recommendation
APLLTD trade ideas

APLLTD BullishBreakout retested on weekly TF
1.618 Fib Level Retested
Took Support from Previos Swing High

Alembic pharma 4HAlembic Pharmaceuticals is exhibiting a cup and handle chart pattern, suggesting potential upward movement
I'm not a SEBI-registered analyst. All posts and levels shared are just for educational purposes. I'm not responsible for any losses or profits. No claims, all rights reserved

Alembic Pharma-Bullish view- Short to Medium term analysis NSE:APLLTD
09.09.2024
Buy-1203
Target 1- 1282
Target 2-1575
Stop Loss- 1020
Risk Reward- 1:2
Holding period- 3 to 6 Months
Very good fundamentals along with below technical analysis
1.Inside bar breakout in weekly TF
2.Trend- Continues uptrend from last one year
3.Price has taken retracement at very strong key level
4.Gradual increase in volumes.
5. Very strong rejection from FVG

Alembic Pharmaceuticals LtdTARGET IN CHART
SL 933
FUNDAMENTALS
Market Cap
₹ 21,647 Cr.
Current Price
₹ 1,101
High / Low
₹ 1,286 / 707
Stock P/E
34.4
Book Value
₹ 245
Dividend Yield
1.00 %
ROCE
13.1 %
ROE
13.3 %
Face Value
₹ 2.00
Price to book value
4.49
Intrinsic Value
₹ 496
PEG Ratio
32.1
Price to Sales
3.43
Debt
₹ 513 Cr.
Debt to equity
0.11
Int Coverage
13.0
Reserves
₹ 4,779 Cr.
Promoter holding
69.6 %
Pledged percentage
0.00 %
EPS last year
₹ 31.3
Net CF
₹ 44.7 Cr.
Price to Cash Flow
27.0
Free Cash Flow
₹ 487 Cr.
OPM last year
15.0 %
Return on assets
9.71 %
Industry PE
36.5
Sales growth
7.28 %

Inverted Head & Shoulder BreakoutThe stock has broken an inverted head and shoulder neckline with 4.5x volumes on a monthly basis. Buy at support of neckline between 1063-1087 for targets of 1285/1450.

APL LTDALEMBIC PHARMACEUT has breakout 4 years resistance level with good volume and this is just for educational purpose only

APL LTDThis stock breakout 4 years resistance level and volumes also increased waiting for strong candle closed
and this is just for educational purpose only

Alembic Pharma - Looking GoodAlembic Pharma completing round and bottom. Above 1146 will be a good buy.

ALEMBIC PHARMACEUT S/R Support and Resistance Levels: In technical analysis, support and resistance levels are significant price levels where buying or selling interest tends to be strong. They are identified based on previous price levels where the price has shown a tendency to reverse or find support.
Support levels are represented by the green line and green shade, indicating areas where buying interest may emerge to prevent further price decline.
Resistance levels are represented by the red line and red shade, indicating areas where selling pressure may arise to prevent further price increases. Traders often consider these levels as potential buying or selling opportunities.
Breakouts: Breakouts occur when the price convincingly moves above a resistance level (red shade) or below a support level (green shade). A bullish breakout above resistance suggests the potential for further price increases, while a bearish breakout below support suggests the potential for further price declines. Traders pay attention to these breakout signals as they may indicate the start of a new trend or significant price movement.
20 EMA: The yellow line denotes 20 EMA, to interpret the 20 EMA, you need to compare it with the prevailing stock price. If the stock price is below the 20 EMA, it signals a possible downtrend. But if the stock price is above the 20 EMA, it signals a possible uptrend.
Disclosure: I am not SEBI registered. The information provided here is for learning purposes only and should not be interpreted as financial advice. It is important to consult with a qualified financial advisor before making any investment decisions. Tweets neither advice nor endorsement.

APLLTD ON A MONTHLY BREAK OUT alembic Pharma is in a good valuetion + growth+ momentum zone. Now Pharma take the leadership role in market and alembic Pharma is good to ride.

APLLTDORB strategy with volume
Educational purpose only not a recommendation above the blue line I will buy sl below Red line

APLLTD Bullish BreakoutAPLLTD looks ready to fire with trendline breakout on RSI and Chart. First retrace to Golden ration and move further.


ALEMBIC PHARMACEUT S/RSupport and Resistance Levels: In technical analysis, support and resistance levels are significant price levels where buying or selling interest tends to be strong. They are identified based on previous price levels where the price has shown a tendency to reverse or find support.
Support levels are represented by the green line and green shade, indicating areas where buying interest may emerge to prevent further price decline.
Resistance levels are represented by the red line and red shade, indicating areas where selling pressure may arise to prevent further price increases. Traders often consider these levels as potential buying or selling opportunities.
Breakouts: Breakouts occur when the price convincingly moves above a resistance level (red shade) or below a support level (green shade). A bullish breakout above resistance suggests the potential for further price increases, while a bearish breakout below support suggests the potential for further price declines. Traders pay attention to these breakout signals as they may indicate the start of a new trend or significant price movement.
Disclosure: I am not SEBI registered. The information provided here is for learning purposes only and should not be interpreted as financial advice. It is important to consult with a qualified financial advisor before making any investment decisions. Tweets neither advice nor endorsement.

"The Alembic Pharmaceuticals (APLLTD) Buying Opportunity"APLLTD, having broken out of an average consolidation and nearing its earlier all-time high levels, is currently forming a triangle pattern. This presents a promising opportunity to enter in this stock, with a stop-loss set below the support trendline.

Alembic PharmaAlembic pharma is looking good for short. Keep an eye on it can give a down rally in the upcoming days.


💥Alembic Pharma💥-Nice Breakout💥Alembic Pharma💥-Nice Breakout
Capital to be deployed-20k
Investing Price-970-980
Breakout Price-966
Stoploss-850
Targets-1378
RT for max reach
#alembic #stockstowatch #StocksToBuy #StocksInFocus #stocks #StockMarket


