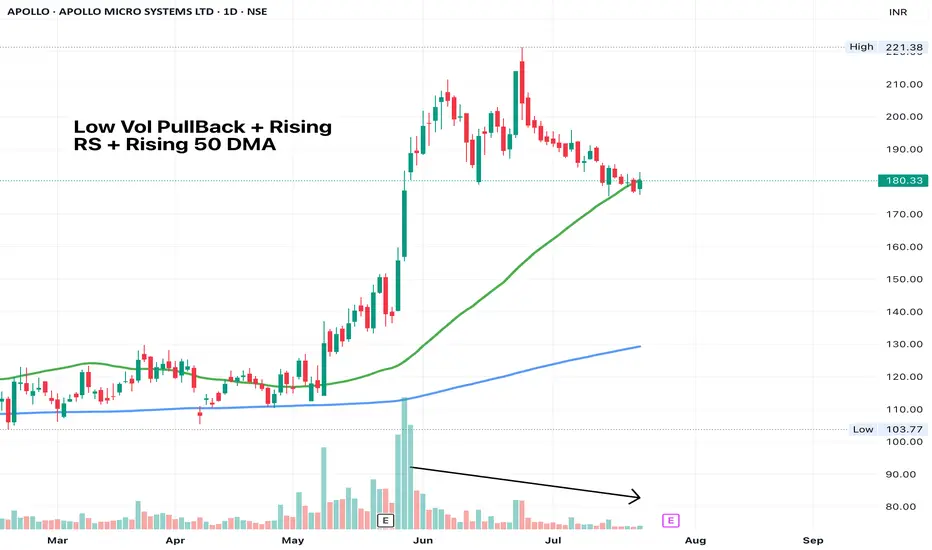
APOLLO - Low vol PullbackWait for one good wide-range candle to take entry. Price often cuts below 50 DMA, forms a small base and gives a breakout candle. This might do that.
SL - Low of the pullback
APOLLO trade ideas
Apollo Micro Systems - Long*Apollo Micro Systems - CMP - 124 / Positional Trade*
*Buy Range 120 - 125 ONLY / Stop Loss 85 in weekly candle closing*
*Target 1 - 150*
*Target 2 - 165*
*Target 3 - 180 / 200*
Disclaimer: This is my view and for educational purpose only.

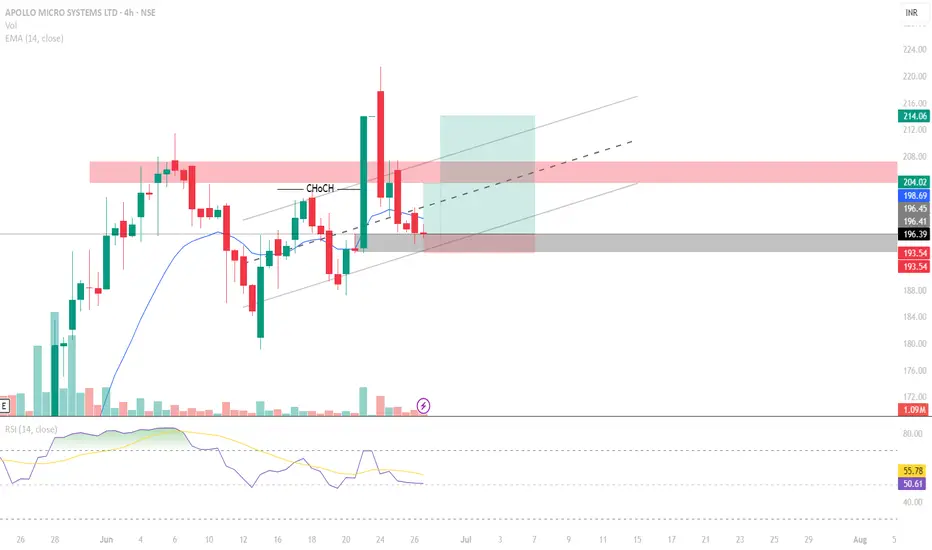
APOLLO MICRO SYSTEMSA 4 Hour CHoCH seen with a huge green closing candle
Tapped into the 50 % OB region
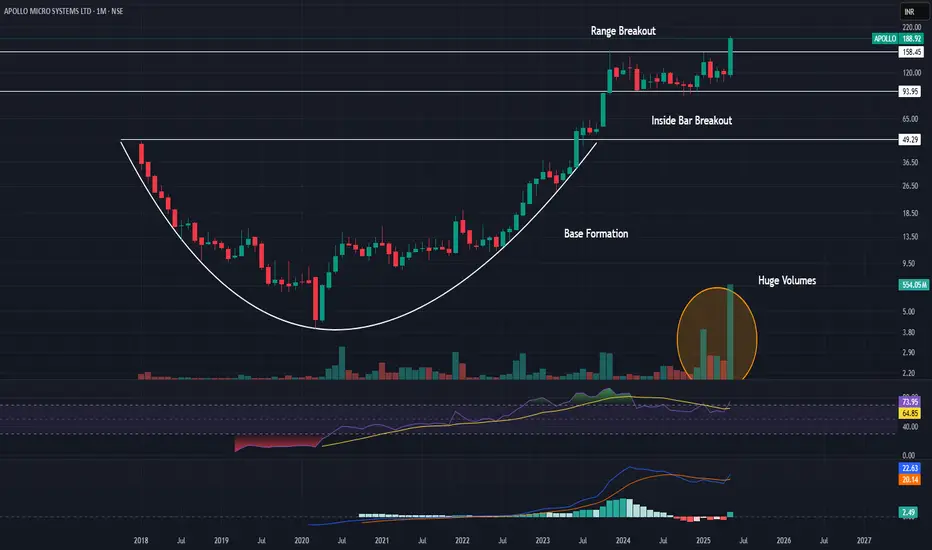
Flag Breakout in Apollo Micro Systems1. Inside Bar Breakout
2. Good Volume
3. Consolidation Breakout
4. RSI above 70
5. MACD signal turning green
Technical Analysis of Apollo Micro Systems LtdTechnical Analysis of Apollo Micro Systems Ltd
Based on the Weekly Time Frame chart, here's a technical analysis of Apollo Micro Systems Ltd (NSE: APOLLO):
Price Action:
Downward Trend: The overall trend seems to be bearish, with the price forming lower highs and lower lows.
Support and Resistance:
Strong Resistance: The 140-162 range appears to be a significant resistance zone.
Safe Buy Zone: The level around 107.22 is indicated as a potential safe buy zone.
Fibonacci Retracement Levels: The 0.382 and 0.5 Fibonacci retracement levels (around 98.16 and 101.27, respectively) could act as support or resistance.
Technical Indicators:
EMA (200, high): The 200-day EMA (66.32) is well below the current price, suggesting a long-term bearish trend.
RSI (14, high): The RSI is currently at 44.14, indicating neutral to slightly oversold conditions.
Interpretation:
Short-Term: The stock seems to be in a bearish phase, and a break below the 107.22 support level could lead to further downside. However, a bounce from the support zone or a break above the 140-162 resistance could signal a potential reversal.
Long-Term: The 200-day EMA below the price suggests a long-term bearish trend, but a sustained move above the 200-day EMA could indicate a change in trend.
Trading Strategies:
Short-Term: Conservative traders may wait for a clear break below 107.22 for a short position or a break above 140-162 for a long position.
Long-Term: A long-term bullish view could be considered if the price sustains above the 200-day EMA and breaks the 140-162 resistance.
Important Note: This analysis is based solely on the provided chart and does not consider any fundamental factors. It's crucial to conduct thorough research and consider various factors before making investment decisions.
Remember: Technical analysis is just one tool in an investor's toolkit. It's always advisable to combine it with fundamental analysis and consider other factors before making investment decisions.
Disclaimer: This is not financial advice. Please consult with a financial advisor before making any investment decisions. We are not responsible for your loss because we are not SEBI registered and this analysis based on technical aspects and only for educational practice. Do your own research.
Thanks for your support as always

Positional Setup – APOLLOMICRO (CMP ₹146.25)🟢 Today’s Action:
Closed at ₹146.25, up +8.33%, showing strong bullish momentum.
Broke out from key resistance at ₹133.18 on strong volume – a clear breakout confirmation.
📈 Technical Highlights:
Resistance at ₹164.17 is the next visible upside target.
Strong support now at ₹133.18, which was previously a resistance zone.
Volume + price breakout after consolidation confirms bullish sentiment.
✅ Positional Trade Setup
Parameter Level
🎯 Entry ₹144–₹146
📌 Stop Loss ₹132 (close below breakout zone)
🎯 Target 1 ₹164
🎯 Target 2 ₹180+ (on closing above ₹164)
⏳ Timeframe 2–5 weeks
🧠 Confluence / Technical Reasoning:
Breakout from sideways consolidation with higher highs and higher lows forming.
Momentum indicators (not visible in chart but assumed) likely in bullish crossover.
Fresh volume activity + recent swing breakout = high conviction setup.

APOLLO MICRO SYSTEM LTD- FOR LONG HOLDING POSITION AND SWINGGood bullish candle braekout in Daily time frame. C.P is 130.21 . price range from 122 to 124 can be the reversal area for upside. If price takes a reversal form that point we can go long for swing next week .

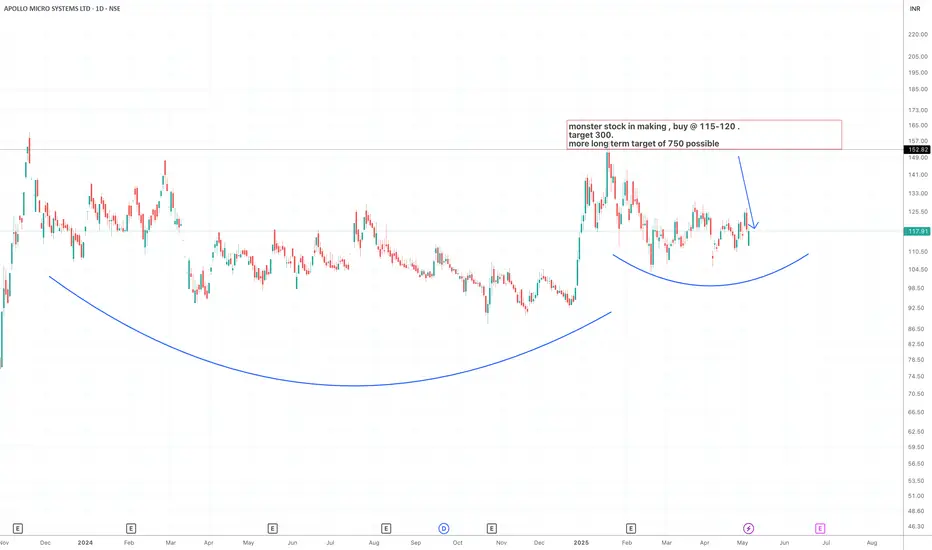
Apollo Micro Systems Target ₹300 soonMonster Stock Alert: Apollo Micro Systems
Two massive cups forming on the daily chart.
📉 Accumulation done.
📈 CMP ₹118 → Target ₹300 soon, ₹750 long-term possible!
Buy zone: ₹115–120.
#Multibagger #Smallcap #ApolloMicro #BreakoutStocks #IndiaGrowthStory
APOLLO Setting up for a HUGE BreakoutNSE:APOLLO - Breakout Setup
🔹 Current Price: ₹122.44 (+2.43%)
🔹 Ascending Trendline Acting as Support
🔹 Potential Upside Target: ₹183.30 (+49.28%)
Technical Analysis:
✅ Strong bullish momentum with higher lows
✅ Breakout confirmation expected around ₹140-150
✅ Volume increase supports upward move
🚀 Potential 50% move ahead if trend sustains!

Apollo momentum comingAs per technical analysis Apollo momentum coming price cross 70 ema
Nearly 30 40% momentum expect
Stock going now LH TO HH

Apollo Micro Systems Ltd: Weekly High Breakout 1. Weekly High Breakout Confirmation
The stock has successfully crossed its weekly high, signaling potential bullish strength.
A strong close above resistance increases the chances of trend continuation.
2. Volume & Market Participation
Rising volume on the breakout suggests institutional buying.
Low-volume breakout could indicate a false move—wait for confirmation.
3. Support & Stop Loss Levels
New support at the previous weekly high—should hold for continuation.
Stop loss below the breakout level to manage risk.
📢 Disclaimer: This analysis is for educational and informational purposes only and should not be considered financial advice. Trading and investing in stocks involve risk, and past performance does not guarantee future results. Always conduct your own research and consult with a qualified financial advisor before making any investment decisions. The author is not responsible for any financial losses incurred. Trade responsibly! 🚀📊

APOLLODisclaimer:
This is not financial advice. Please do your own research or consult with a financial advisor before making any investment decisions. Investments in stocks can be risky and may result in loss of capital.

APOLLO MICRO SYSTEM - PARABOLIC BULLISHNSE:APOLLO Weekly chart showing momentum and accumulation done near parabolic location may continue further rally.

Apollo Micro Systems LtdApollo Micro Systems Ltd
stock price moves above a resistance level or below a support level, it's considered a breakout. This often indicates that the stock's price may continue to move in that direction

Amazing breakout on MONTHLY Timeframe - APOLLOCheckout an amazing breakout happened in the stock in Weekly timeframe, macroscopically seen in Daily timeframe. Having a great favor that the stock might be bullish expecting a staggering returns of minimum 25% TGT. IMPORTANT BREAKOUT LEVELS ARE ALWAYS RESPECTED!
NOTE for learners: Place the breakout levels as per the chart shared and track it yourself to get amazed!!
#No complicated chart patterns
#No big big indicators
#No Excel sheet or number magics
TRADE IDEA: WAIT FOR THE STOCK TO BREAKOUT IN WEEKLY TIMEFRAME ABOVE THIS LEVEL.
Checkout an amazing breakout happened in the stock in Weekly timeframe.
Breakouts happening in longer timeframe is way more powerful than the breakouts seen in Daily timeframe. You can blindly invest once the weekly candle closes above the breakout line and stay invested forever. Also these stocks breakouts are lifelong predictions, it means technically these breakouts happen giving more returns in the longer runs. Hence, even when the scrip makes a loss of 10% / 20% / 30% / 50%, the stock will regain and turn around. Once they again enter the same breakout level, they will flyyyyyyyyyyyy like a ROCKET if held in the portfolio in the longer run.
Time makes money, GREEDY & EGO will not make money.
Also, magically these breakouts tend to prove that the companies turn around and fundamentally becoming strong. Also the magic happens when more diversification is done in various sectors under various scripts with equal money invested in each N500 scripts.
The real deal is when to purchase and where to purchase the stock. That is where Breakout study comes into play.
LET'S PUMP IN SOME MONEY AND REVOLUTIONIZE THE NATION'S ECONOMY!

apollo micro--breakout stockin 5th ( 1st) wave breaking out of accumulation . We have a target of 180 and above . Can be accumulated on every dip as 5th wave is a fast rise.

Apollo Micro Systems Ltd.*Appollo Micro Systems Ltd*
P&F Formation on Yearly Basis.
Strong Retest & Upswing begins.
Strong Vol. Accumulation done.
RSI: 1H >D>W<M. All in Higher Bullish Zone.
EMAs: Widening Gaps amongst 20 50 100 200 levels at Weekly Basis.
*Trail SL with Upside*
*Book Profit as per Risk Appetite*
Improving Sales / Profitability on Yrly/Qtrly Basis. Increasing TNW resulting in improved leverage.
Concerns:
Pledged holding, Contingent liabilities & High WC Cycle.
Negligible FII/DII stake.
*This is an Opinion. Do your own research as well.*
*_Happy Investing_*🤓

Apollo Stock Analysis Apollo Stock Analysis: Potential Breakout Opportunity
🚀 Technical Setup:
Apollo's stock is showing a promising setup, with a breakout above a descending trendline in sight. The stock has been consolidating in a triangular pattern for months, with reduced volatility and volume contraction signaling accumulation.
Key Levels to Watch:
Buy Trigger: Above ₹105 (confirmed breakout level).
Stop Loss (SL): Day's low below the breakout candle to manage risk.
Target: ₹170, offering a potential upside of 62.4%.
Volume Perspective:
Volume Spike: Recent sessions have shown above-average volume, indicating growing interest among buyers.
Volume Buzz: 45% above the average, confirming active participation.
Strategy:
First position added during the accumulation phase near ₹98.41. A second tranche can be added once the stock clears ₹105 with conviction.
📊 Risk-Reward Ratio: Favorable setup for traders seeking high-probability breakouts. Adherence to the SL ensures disciplined trading.
📈 Outlook:
With strong volume support and a clear breakout trigger, Apollo stock could embark on its next leg up. Watch for sustained buying momentum and confirmation above ₹105.

APOLLOAPOLLO
Weekly timeframe
i just shared my experience it is not an invite or recommendation to trade.
if youn any doubt means Please leave comments for any query.
best wishes
DYSON


Small Cap Multibagger Defence Stock (Independence Day Pick)Apollo Micro Systems Ltd.
Technically price is moving inside a descending channel forming WXY corrective pattern as wave 4.
As per conventional TA, death cross has formed on 5th August. Further downside is expected.
Fundamentally it is overvalued, so it is underperforming since November 2023.
During last 3 years, the company has been spending aggressively on equipments to cater the increasing demand.
Company is able to maintain healthy profit margin.
Good to accumulate around 70-80 level for the following targets:
Medium term target @ 240 (210% ROI)
Long term target @ 380 (390% ROI)
Do your own due diligence before taking any action.
Peace!!

Apollo Micro Systems - Strong Bullish Momentum (Buy & Hold)Technical Analysis of Apollo Micro Systems (APOLLO)
Overview of the Stock - The chart presents a one-hour timeframe analysis of Apollo Micro Systems (APOLLO) on the NSE. It includes:
My Technical Analysis
Price Action:- The price seems to be in an uptrend, as indicated by the higher highs and higher lows. It's currently testing the 0.5 Fibonacci retracement level, which could act as a support level. A break below this level might indicate a potential reversal.
Moving Average: - The price is above the 200 EMA, suggesting a bullish bias.
Fibonacci Retracement:- The 0.5, 0.618, and 0.786 Fibonacci retracement levels are acting as potential support and resistance areas.
RSI: - The RSI is currently above the 50 level, indicating bullish momentum.
However, it's approaching the overbought zone, which might suggest a potential price correction.
Potential Scenarios - As per technical analysis based on indicators, there are two trend scenarios
Bullish scenario: If the price holds above the 0.5 Fibonacci level and the RSI cools down without entering the overbought zone, the uptrend might continue. The next resistance levels to watch are the 0.618 and 0.786 Fibonacci levels.
Bearish scenario: A break below the 0.5 Fibonacci level could trigger a downside move. The next support level to watch is the 200 EMA.
Trading Ideas (for informational purposes only)
Potential long entry: If the price bounces off the 0.5 Fibonacci level with increased volume, a long position could be considered, with a stop-loss below the recent low.
Potential short entry: If the price breaks below the 0.5 Fibonacci level with high volume, a short position could be considered, with a stop-loss above the recent high.
Remember: This analysis is a snapshot in time, and market conditions can change rapidly. It's crucial to conduct further analysis and consider other factors before making any investment decisions.
Disclaimer: - This analysis is based solely on the provided chart and does not consider fundamental factors. It's essential to conduct thorough research before making any investment decisions as I am not SEBI registered person and this analysis is only for educational purpose
Thanks for your support as always

Apollo Micro Systems making moves in the upward direction. Apollo Micro Systems Ltd. engages in the manufacture of Aerospace and Defence related electronic components and systems. It includes electronic manufacturing, hardware design, information technology and software, electronic, and mechanical services. It also offers space, and transportation solutions.
Apollo Micro Systems Limited (AMS) CMP is 108.89. The positive aspects of the company are Company with Low Debt, Annual Net Profits improving for last 2 years and Company with decreasing Promoter pledge. The Negative aspects of the company are PE higher than Industry PE, Declining Cash Flow from Operations and Companies with weak financials.
Entry can be taken after closing above 109. Targets in the stock will be 112, 118 and 125. The long-term target in the stock will be 133, 140 and 147. Stop loss in the stock should be maintained at Closing below 102 or 93 depending upon your risk taking ability.
The above information is provided for educational purpose, analysis and paper trading only. Please don't treat this as a buy or sell recommendation for the stock. We do not guarantee any success in highly volatile market or otherwise. Stock market investment is subject to market risks which include global and regional risks. We will not be responsible for any Profit or loss that may occur due to any financial decision taken based on any data provided in this message.
