Apollo Hospitals Getting Ready for TakeoffApollo Hospital's daily timeframe reveals the formation of a falling wedge pattern, characterized by a narrowing price range with lower highs and lower lows. This pattern often signifies a potential bullish reversal. Traders may consider monitoring for a breakout above the upper trendline as a signal to enter long positions, with careful risk management strategies in place to navigate potential volatility.
APOLLOHOSP trade ideas

enter long above 4250enter long above 4250 or wait for 4114 -4165 level with 4095 as stoploss for a target of 4250 ----4356 ---4414 ----------4417

Apollo Hopsital wave 5Apollo Hospital is a buy in 5800-600 range with 5600 stop loss for targets of 6800 7800 in coming weeks

APOLLO HOSPITALSW pattern breakout 1:4 risk reward stock gave good opportunity for swing trade and this is only for educational purpose

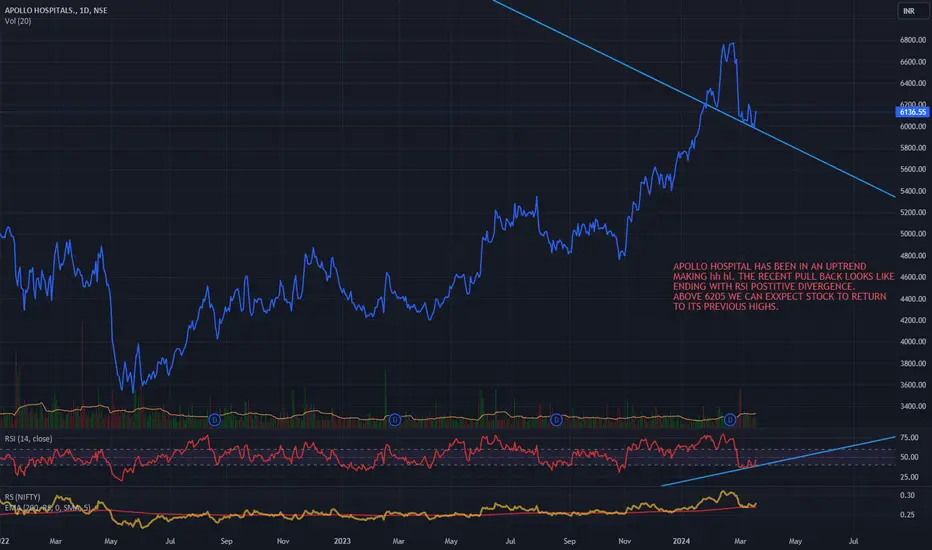
Apollo hospitalsStock in an uptrend with higher highs n higher lows. Last pull back seems halted after Rsi positive divergence.
APOLLOHOSP: MY NEXT SWING TRADE PLANAPOLLOHOSP
The fundamentals of Apollohosp are very good. It is a profitable company, with average P/E.
The technicals of Apollohosp are indicating buy.
Please watch full video to understand.

Apollo Hospitals - An Investment pick for the Mid Term, 50% ROI The stock has broken out decisively in Monthly Jan 2023 after 2 years of good consolidation.
The yearly time frame indicates an inside candle showing the consolidation.
The best entry zones are marked in red. One may enter based on Risk appetite.
For a target of 9653 to 10000.

Apollo HospitalsHospital sector is breaking out and Apollo hospitals looks strong and appears to be heading to 7500 Levels. Any dip to 5950-6000 is a buy opportunity with a SL below 5400. Long term target is 10050.

APOLLOHOSPNSE:APOLLOHOSP
One Can Enter Now !
Or Wait for Retest of the Trendline (BO) !
Or wait For better R:R ratio !
Note :
1.One Can Go long with a Strict SL below the Trendline or Swing Low.
2. R:R ratio should be 1 :2 minimum
3. Plan as per your RISK appetite and Money Management.
Disclaimer : You are responsible for your Profits and loss, Shared for Educational purpose

Apollo Hospitals - Management Quality and Economic MoatNSE:APOLLOHOSP
Apollo Hospitals Enterprise Ltd, a prominent healthcare service provider in India, has shown significant management quality and a strong economic moat.
Management Quality:
Strategic Growth and Diversification: Apollo Hospitals has focused on expanding its services, including elective surgeries and diagnostics. This diversification and expansion into various healthcare segments highlight effective strategic planning.
Financial Performance: The company has demonstrated robust financial growth over the years. Notably, there has been a substantial increase in net sales, EBITDA, and PAT (Profit After Tax), indicating a healthy financial status. This growth trajectory reflects strong operational capabilities and a successful business model.
Operational Efficiency: The efficient operation of Apollo Hospitals is evident from the significant YoY growth in its Hospital segment and the Pharmacy business. The company has also entered into a 10-year commercial agreement with Amazon India, which is a strategic move to enhance its reach and operational efficiency.
Economic Moat:
Market Position and Brand Recognition: Apollo Hospitals is well-recognized in the healthcare industry, which contributes to its competitive advantage and customer loyalty.
Integrated Business Model: The company's integrated business model, covering a wide range of services from primary to tertiary health requirements, strengthens its position in the healthcare sector.
Operational Network: Apollo Hospitals' extensive operational network fuels its business growth, enabling it to serve a broad customer base effectively.
Strengths and Weaknesses:
Strengths:
Strong operational performance and network.
Growth initiatives that indicate potential for future expansion and development.
Weaknesses:
A noted decrease in working capital, which could impact business growth.
Challenges such as the dearth of healthcare professionals and stringent industry regulations.
In summary, Apollo Hospitals Enterprise Ltd exhibits strong management quality, marked by effective strategic planning, robust financial performance, and efficient operations. The company's economic moat is underpinned by its market position, integrated business model, and extensive operational network. While there are strengths in its operational performance and growth initiatives, the company must address issues related to working capital and navigate the challenges posed by regulatory environments and workforce management

ApolloHospitals share longApollo Hospitals share analysis one hour chart
this stock upside move count impulse wave 1 to 9 wave complete and downside start correction Wave (a,b or c) . 0-b trendline breakout price

Reversal Rising Wedge pattern in APOLLOHOSPAPOLLO HOSPITAL LTD
Key highlights: 💡⚡
📈 On 1 Hour Time Frame Stock Showing Reversal of Rising Wedge Pattern.
📈 It can give movement upto the Reversal Final target of Above 5680+.
📈 There have chances of breakout of Resistance level too.
📈 After breakout of Resistance level this stock can gives strong upside rally upto Above 5950+.
📈 Can Go Long in this stock by placing a stop loss Below 5340-.


💥Apollo Hospital💥-Nice Breakout💥Apollo Hospital💥-Nice Breakout
Capital to be deployed- 20k
Investing Price-5460-5470
Breakout Price-5456
Stoploss-4640
Targets-6848-12472
RT for max reach
#apollohospital #stockstowatch #StocksToBuy #StocksInFocus #stocks #StockMarket


Apollohospi have use this level for swing trade....
plan to sell based on this level if got signal .....
Thanks to everyone for follow and appreciate....
Happy Profitable trading ......
Octafx copy trade :BidaskeyTraders
Note:
This isn't financial advice, (not a buy or sell signal). This is only Knowledge sharing based on my knowledge and my risk management . Before following any ideas, do your own research and practice good risk management as of your financial status.

APOLLOH - Stock Analysis**Technical Analysis:**
Apollo Hospitals Enterprises Ltd displays several robust technical signals indicating a bullish trend. The HighLow indicator suggests a "Strong Bullish" sentiment, with the stock hovering near a one-year high and the potential for a new high. The OneDay signal is "Strong Bullish," with the latest tick showing a strong price rise supported by substantial trading volume. The PSAR indicator is "Bullish" with a bullish crossover. The KeltnerBand, MACD, DonchianBand, HighLowBand, MAChannelBand, and Supertrend all show "Strong Bullish" signals, indicating positive breakouts and strong trends.
Notably, the MACD exhibits a "Strong Bullish" signal with a bullish crossover between the MACD and signal line. However, it is worth noting that the MACD has been showing frequent crossovers, suggesting potential fluctuations in the trend.
**Candlestick / Heikin Ashi Patterns:**
The daily candlestick patterns are "Strong Bullish." A bullish gap-up pattern formed at a high level, indicating strong momentum, supported by good trading volume. Additionally, a bullish Heikin Ashi pattern has formed on the daily chart, further reinforcing the bullish sentiment. On the weekly chart, a "Neutral" spinning top continuation Heikin Ashi pattern has been observed.
**Fundamental Metrics:**
Fundamentally, Apollo Hospitals Enterprises Ltd presents strong metrics. The book value has been trending upward over the past three years, reflecting improved financial strength. The company has achieved a commendable Return on Equity (ROE) of 11.13%, highlighting the efficient use of shareholders' equity. In addition, there is a positive short-term trend in total sales and net profit, with annual sales showing consistent growth for three consecutive years. Quarterly sales have been trending upward over the past five years, and there has been a steady increase in total assets over the last three years.
In light of the analysis, the recommendation for potential investors is to "Go Long" on Apollo Hospitals Enterprises Ltd when the stock price rises above 5165.50, with a suggested stop loss set at 4678. It is crucial to exercise caution and consider other market conditions and individual financial goals before making any investment decisions.

Test 8: StockShort term correction/sideways and Pro trend bullish ... till hold 4550
Note:
This isn't financial advice, but an analysis of coin movement (not a buy or sell signal). Before following any ideas, do your own research and practice good risk management.

apollo hospital stockthis stock also made triangle pattern let see this for one week because it not even breakout


Apollo Hospital bearish rejection from major trendlineApollo Hospital ,
Sell below 5060
Buy Above 5200
Rejection from major trend line but observe a support trend line look for support or break near the support trendline


APOLLOHOSP ViewsThis script is trading above the value area and now attracts me to add itself in the watchlist.
Good to be watching it for the study purposes.
