APOLLOPIPE LONG TERM ANALYSISThanks for stopping by.
All analysis here is done strictly from an investor’s perspective — focusing on risk, return, valuation, and potential upside.
The notes cover key details. I’ve backed every thesis with my own analysis — no fluff, just what matters to investors.
If you find the idea useful or have suggestions, feel free to leave a comment. Always open to fresh insights.
Kind regards,
Psycho Trader
APOLLOPIPE trade ideas
Trade Idea: Long-Term Investment Opportunity in Apollo Pipes LtdEntry Zone: ₹397–₹360
Stop Loss: Daily close below ₹310
Target: Long-term hold or book profits at ₹677
TradingView
Company Overview:
Apollo Pipes Ltd is a leading Indian manufacturer specializing in high-quality plastic piping solutions. The company's extensive product portfolio includes CPVC, UPVC, and PPR-C plumbing systems, HDPE pipes, fittings, and water storage solutions. With over 35 years of experience, Apollo Pipes operates multiple state-of-the-art manufacturing facilities across India, including locations in Dadri (Uttar Pradesh), Ahmedabad (Gujarat), Tumkur (Karnataka), and Raipur (Chhattisgarh), boasting a total production capacity of 136,000 MTPA. Groww
Financial Highlights:
Market Capitalization: Approximately ₹1,731 crore
Price-to-Earnings (P/E) Ratio (TTM): 58.49
Return on Equity (ROE): 8.75% over the past three years
Dividend Yield: 0.23%
Debt-to-Equity Ratio: 0.20
Investment Rationale:
Apollo Pipes Ltd has demonstrated consistent growth, supported by its diversified product range and robust distribution network. The company's strategic manufacturing locations enhance its ability to serve various regions efficiently. Despite a modest ROE and a relatively high P/E ratio, the company's low debt-to-equity ratio indicates prudent financial management. Investors may consider entering within the specified price range, setting a stop loss at a daily close below ₹310, and aiming for a long-term hold or booking profits at ₹677.
Disclaimer: This trade idea is for informational purposes only and does not constitute financial advice. Investors should conduct their own research or consult with a financial advisor before making investment decisions.

APOLLOPIPE Trading Within Tested Demand ZoneAPOLLOPIPE is currently trading at ₹467.7, positioned within its tested demand zone between ₹468 and ₹452.7, established on 25th November 2024. As this zone has already been tested, it reflects previous buying interest. Investors may monitor for renewed support within this range to assess trading opportunities.
Disclaimer: This analysis is for informational purposes only and should not be considered as financial advice. Please conduct your own research or consult a financial advisor before making any investment or trading decisions.

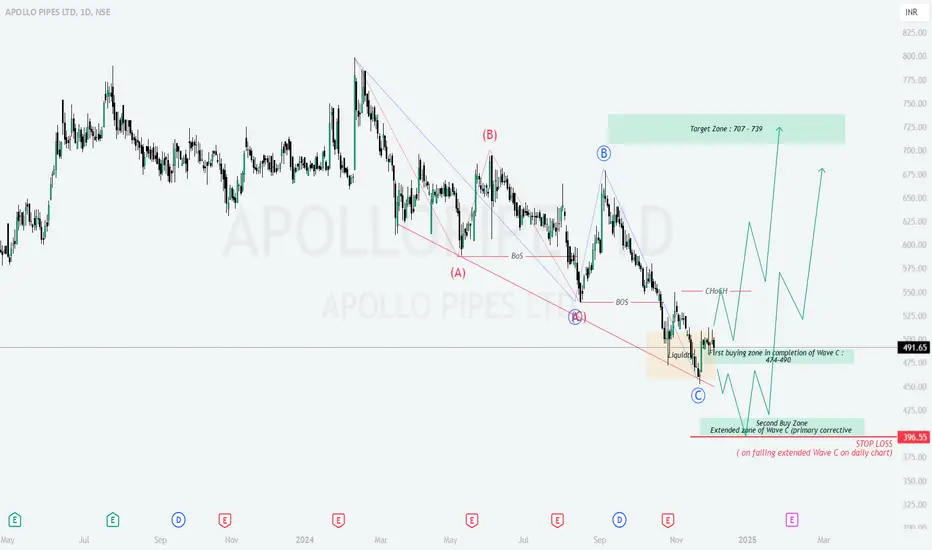
APOLLOPIPE : A Two-Zone Buy Setup with Strong Upside PotentialApollo Pipes Ltd. (APOLLOPIPE):
Current Price: ₹491.65
Chart Observations:
This stock has completed a primary corrective wave (A-B-C) , forming a liquidity zone around ₹474–₹490.
A deeper secondary buy zone is identified between ₹398 and ₹417, which aligns with the extended Wave C retracement.
The chart exhibits a Change of Character (ChoCH) , signaling a potential reversal, followed by a bullish impulsive wave projecting toward higher levels.
Buying Levels:
First buying zone: ₹474–₹490
Second buying zone: ₹398–₹417 (for positional traders).
Stop Loss:
For Zone 1 Entry: ₹396 (on failure of Wave C structure).
For Zone 2 Entry: ₹380 (a safer placement below structural support).
Target:
First Target: ₹707
Second Target: ₹739
Pro Tip to Avoid SL Hunting: Observe a sustained bullish price action above ₹490 (such as higher highs and higher lows) before committing to the first entry zone.
Disclaimer: This analysis is for educational purposes only . Investments in stocks and financial markets involve risks, including the loss of principal. Always conduct your own due diligence or consult with a certified financial advisor before making any investment decisions.
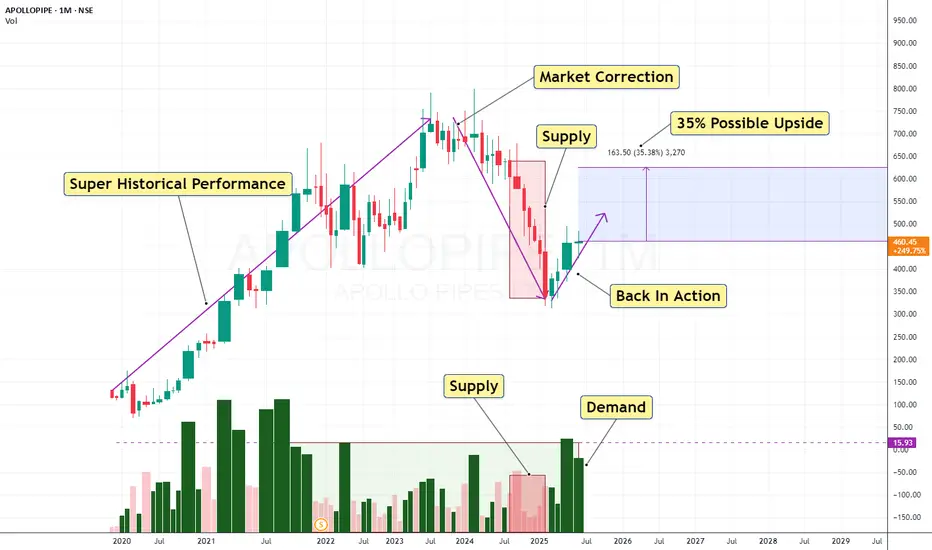
Emerging Real Estate, Infrastructure (nal jal yojna) & PM Aawas Apollo pipes ltd is having good dealership network in north India, once they spread across the rest of the country, they will undoubtedly at among top players in upvc and pvc pipes.
one can bet on their stock for coming 3 years, buy strategically at current level 538-542, accumulate more around at 494 finally buy more at 430 for the first target of 600 second target at of 750 finally book profit at 900 all above targets are likely to observe by the end of December24 to January 2025.
This is not a buy recommendation, this is my personal idea and view for upcoming 6 months to 3-year time frame, one should take advise from his financial advisor before investing.
Refer Chart for Logic and Analysis methodology.

Apollo Pipes breaking out of the downtrend on 1D timeframeApollo Pipes has finally ended the downward flow and is starting to breakout of its daily trend. Would be a good place to enter and then hold till 1:2. Start trailing if needed after 1:1.

APOLLOPIPESStock name = Apollo Pipes Limited.
Weekly chart setup
Chart is self explanatory. Levels of breakout, possible up-moves (where stock may find resistances) and support (close below which, setup will be invalidated) are clearly defined.
Master Score - B
Disclaimer: This is for demonstration and educational purpose only. this is not buying and selling recommendations. I am not SEBI registered. please consult your financial advisor before taking any trade.

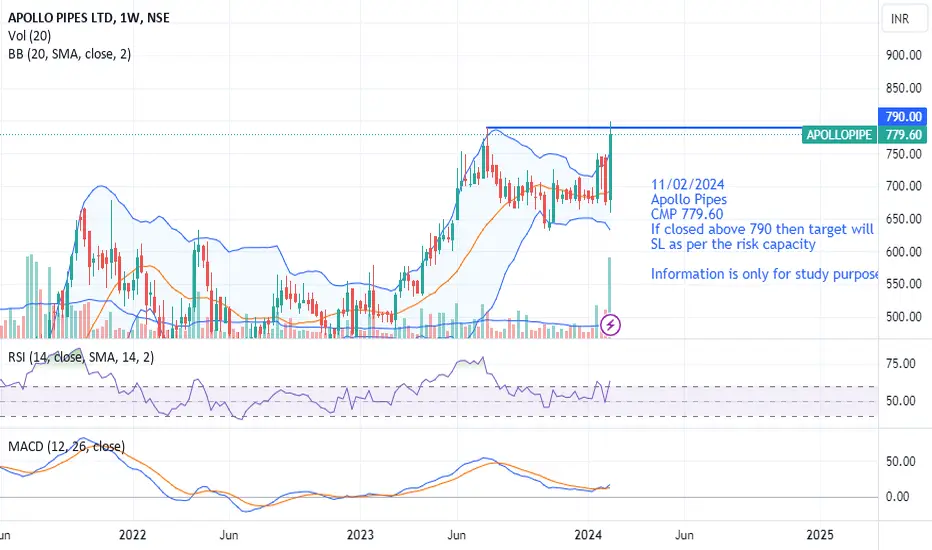
Apollo Pipes11/02/2024
Apollo Pipes
CMP 779.60
If closed above 790 then target will be 10 to 20%
SL as per the risk capacity
Information is only for study purpose
Apollo Pipe - LongApollo Pipes can be looked at from medium to long term. It is BO on weekly closing basis with huge volumes buildup.

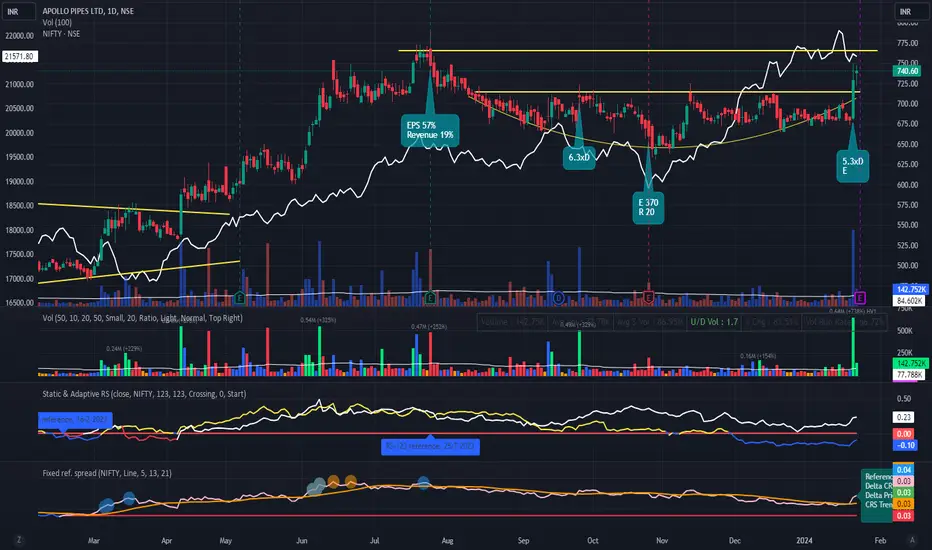
APOLLOPIPE Near ATHAt very interesting point. coming out of a base with a good volume. Quarterly result to come in few days.
APOLLOPIPE APOLLOPIPE is showing a breakout. The ideal stop loss will be the recent low (680.90), and the target will be the pattern high.

💥Apollo Pipes💥-Nice Breakout💥Apollo Pipes💥-Nice Breakout
Capital to be deployed- 20k
Investing Price -644
Breakout Price -644
Stoploss-581
Targets-814-1689
RT for max reach
#apollopipes #StocksToBuy #stocks #StocksToTrade #StocksInFocus #stockstowatch #StocksInNews #SwingTrading #BREAKOUTSTOCKS

Volume Raise and Buying Interest But Wait For Green CandleHere is technical analysis about APOLLOPIPE
The overall trend is up. The price has been rising for the past few months.
There is a bullish triangle pattern forming on the 1-hour chart. This is a continuation pattern, which suggests that the uptrend is likely to continue.
The MACD indicator is bullish. The MACD line is above the signal line, and the MACD histogram is positive. This indicates that the momentum is in favor of the bulls.
The OBV indicator is also bullish. The OBV line is rising, which indicates that volume is increasing as the price is rising. This suggests that there is strong buying interest in the stock.
Overall, the technical indicators suggest that the moving trend of APL stock is up. The bullish triangle pattern on the 1-hour chart is a bullish continuation pattern, and the MACD and OBV indicators are both bullish. This suggests that the uptrend is likely to continue.
However, it is important to remember that technical analysis is not a perfect science. There is always the possibility of a reversal. Therefore, it is important to use technical analysis in conjunction with other factors, such as fundamental analysis, to make investment decisions.
Here are some additional things to keep in mind when interpreting this chart:
The bullish triangle pattern is still in its early stages, so it is too early to say for sure whether it will break out to the upside.
The MACD indicator is still relatively new, so it is important to see if it can maintain its bullish momentum.
The OBV indicator has been rising for a while, so it is possible that it is reaching overbought levels.
Overall, the technical indicators suggest that the moving trend of APL stock is up. However, it is important to keep these factors in mind when making investment decisions.
Here are some possible trading strategies based on the analysis:
A buy signal could be generated if the price breaks out of the bullish triangle pattern on the 1-hour chart.
A stop-loss order could be placed below the support level at 673.50.
A profit-taking target could be placed at 725.00.
It is important to note that this is just a technical analysis and does not guarantee any profits. It is always advisable to do your own research before making any investment decisions.

Breakout chartU shaped pattern having chance to 20% upside no recommendation
Please ask your stock may I help on that chart of your stock

APOLLO PIPES APOLLO PIPE - Anti cypher
A daily close above Point B will trigger an upside till Point D
Wait for definite close, do not rush entry


APOLLO PIPESChat seems very bullish so we can expect minimum 30-40% move in this upcoming month.
Iam very bullish in this stock because volume and price action seems very aggressive.


Buy at 600stock is in good upmove
It give good breakout of channel
Volumes also looks good
Let it be retrace littile then make long position

Apollopipe : Going long at 1660 Going long with support line as Closing basis stop loss. This month stop-loss going to be wider because market is trending and supports levels are far. Please keep in mind on position size before initiating the trade.


BREAKOUT IN COMING DAYS FOR APOLLOPlease maintain your position with strict stoploss, breakout possible in either direction.

