APOLLOTYRE trade ideas


Apollo Tyres - LongApollo tyres is also an interesting Wave
with entry now at 223 and SL at 196.
Intraday play would be tricky, will prefer to enter for intraday momentum after strong closing at 228.
Go long.

apollo tyreindia
The revenue grew by 49% YoY to ₹3,630 crore in Q4 FY21. The growth was on account of positive
demand momentum across key segments and channels, driven by preference for personal mobility,
government spend on infrastructure, import restrictions and recovery in sectors like mining.
• It had an EBITDA margin of 17.3% in FY21 and a growth of 45% YoY.
• Aided by strong performance in Q4, it had a volume growth of ~5% for FY21. All its plants were
operating at full capacity.
• It increased prices in replacement segment by ~4.5% in H2 FY21.
• In the first eleven months of FY21, it had a market share of ~21% in agriculture and passenger vehicle
and ~30% in truck & bus (radial) segment, i.e., an expansion of ~350 bps and ~150 bps, respectively.
• It had a sustained recovery in the OEM (original equipment manufacturer) segment.
It expanded its distribution footprint with over 550 dealers in FY21. Touch points in rural India
increased by more than 4 times.
EUROPE
• The revenue grew by 8% YoY to €135 million in Q4 FY21. Despite adverse market conditions, it
expanded its customer base and added over 300 customers during the year.
• It had a market share gain of 17 bps in UHP (ultra-high performance) segment and 41 bps gain in TBR
(truck bus radial) segment.
• The improvement in sales mix of UHP/UUHP (ultra ultra-high performance) segment accounted for
~36% of PCLT (passenger car and light truck) sales in volume terms.
• It successfully completed Dutch plant specialisation which led to significant improvement in cost
competitiveness and a strong operating performance during the quarter.
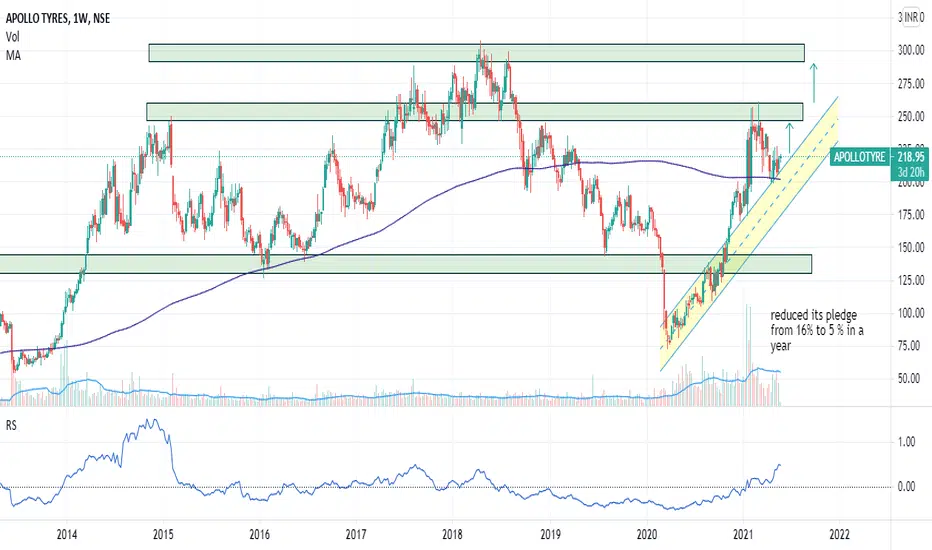
Apollo at attractive levelsAnother stock that came on my radar is apollo tyre.
The stock has been moving in a range for the past 4 months.
Last week its closed well near its highs.
Now if the stock sustains 190 levels on the weekly basis, the stock might test its upper range 240- 255.
And if the range breaks on the upside, the stock could test its all-time highs i.e. 307.25.

APOLLOTYRE watch this level for target of 225, 230, 245 ++ it has been consolidating since 12 the april on its support zone and now it has given good up move let's see if we can catch the bull run

APOLLOTYRE LONG INTRADAY 14 MAY, 2021Dear trader,
If u look at the chart of APOLLOTYRE (analysis based intraday only) the APOLLOTYRE Buy at 222 and
Target at 232
Best Buy at 218.
Our Best Buy is based on high quality research and when the instrument reaches this level , it’s a jackpot trade.
Best Buy level might be executed or might not be executed.
The chart clearly indicates Bullish Trend you can also see the candle stick patters for more indepth analysis.
In Intraday most important thing is to enter and exit points.
Our signals are based on analytics, algorithms, mathematical derivatives.
Always be a responsible trader, kindly trade only when you have maximum opportunity in the market with minimum risk and with keynotes like data, analysis and proper strategies.
Kindly message us for strategies and analysis.


Apollotyre Downtrend Apollo Tyre Making Lower Low. Retraced to fibo level and heading towards the lower support.


Conventional pattern in ApoIlo tyer On daily chart ApoIlo tyer has formed ascending tringle with broken major resistance of 230.
Having upper supply rove at 240.

APOLLOTYRE longIt forms an Inverse HEAD AND shoulder pattern. Entering a long position when the price move above the neckline.
T1 235 WITH STOPLOSS 220

Double bottom..When a market is going to positive direction their will be nice to move on upward direction...

Double bottom ... When a market is going in positive direction their will be nice move on upward side...

apollotyre head and sholder pattren 1 d strong sell apollotyre head and sholder pattren 1 d strong sell


Key Levels of Apollo TyreThe Apollo Tyre stock is consolidating for some days
Big move is expected in near future:-
Go long near support area with bullish confirmation candle only:-
