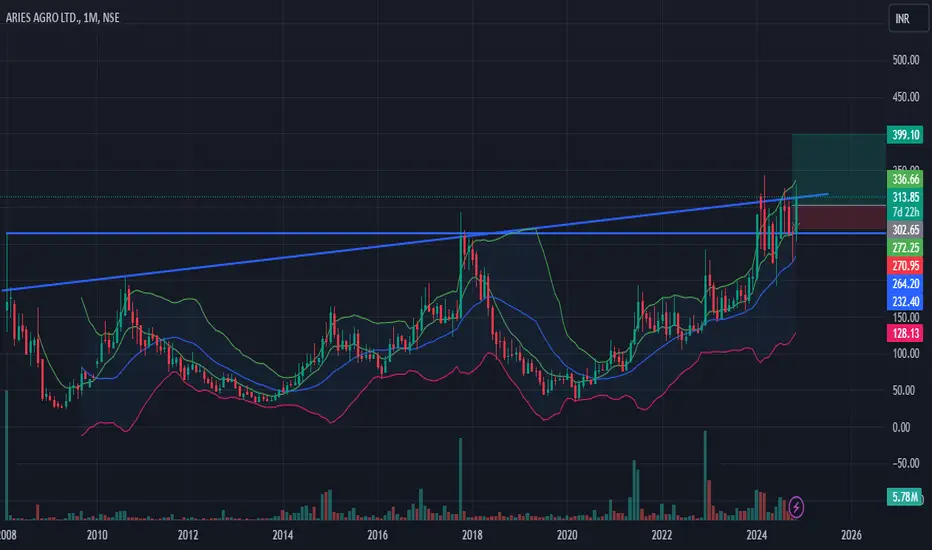
Breakout Soon StockBreakout Soon Stock with strong fundamental
stock trading in a parellal channel and now ready for a breakout
26.15 INR
340.23 M INR
6.27 B INR
4.90 M
About ARIES AGRO LTD.
Sector
Industry
CEO
Rahul T. Mirchandani
Website
Headquarters
Mumbai
Founded
1969
ISIN
INE298I01015
FIGI
BBG000R4X9P8
Aries Agro Ltd. engages in the manufacture and trading of micronutrients fertilizer. It offers multi-micronutrient fertilizers, chelated micronutrient fertilizers, value added secondary nutrient fertilizers, water soluble NPK fertilizers, and other natural and biological products and water treatment formulations. The company was founded by Thakurdas Bhagchand Mirchandani and Bala Mirchandani on November 27, 1969 and is headquartered in Mumbai, India.
Related stocks

50 SMA Rising- Positional TradeDisclaimer: I am not a Sebi registered adviser.
This Idea is publish purely for educational purpose only before investing in any stocks please take advise from your financial adviser.
Its 50 SMA Rising Strategy. Suitable for Positional Trading Initial Stop loss lowest of last 2 candles and keep tra

ARIES CMP 313STRONG Undervalued stock by Indicator- PE IS 15,Price to Book Value- 2,Face Value-10.TTM compounded Profit growth is super Sales Growth increasing.Last quarters results are positive.For long term we can add this to Portfolio.Last Months Volumes are Good.Currently trading its 52 Week high zone. If su
ARIES AGRO 1WAn interesting trend is observed in Aries Agro's stock behavior: historically, November and December consistently show green candles, while March often records a red candle. Could there be underlying factors or seasonal dynamics driving this pattern?
I'm not a SEBI-registered analyst. All posts a

ARIES AGRO: 50% Profit in Intraday TradeARIES AGRO (15-Minute Timeframe) - Intraday Sensation!
Trade Overview:
Aries Agro delivers a phenomenal intraday performance, achieving a 50% gain with 5x margin trading. All targets are marked with clear progression on the chart using the Risological trading indicator.
Key Levels:
Entr

Aries Agro Near Breakout of Inverse Head and Shoulder Pattern🚀 Aries Agro Near Breakout of Inverse Head and Shoulder Pattern! 🚀
Current Market Price: 278
Stop Loss: 248
Targets: 325, 346, 386
With the budget approaching, fertilizer stocks are on a good run. Aries Agro is showing promising signs. If the stock breaks out above 287, it will confirm two breakou

aries agroARIES AGRO (CN) reported a consolidated net profit of 78.1 million rupees in Q3, an increase from 51.2 million rupees. The consolidated revenue from operations for the same period was 1.90 billion rupees, up from 1.71 billion rupees.

Bullish ViewBuy around the CMP 174 and hold for sometime
First target to the neck line around 240, then 290 and more

ARIES - TRIANGLE BREAKOUT - LONG 10%ARIES - TRIANGLE BREAKOUT - LONG 10%
There is a triangle breakout in Aries - Day
Target 1 - 5%

Aries agroHuge breakout with very huge volumes was seen in aries agro today. against usual volumes of 50000-200000, a volume of 15,00,000 was seen pushing the stock to breakout from the resistance zone of 160-170. Can be bought keeping in mind 200 as the first resistance for eventual target of 260+

See all ideas
Summarizing what the indicators are suggesting.
Oscillators
Neutral
SellBuy
Strong sellStrong buy
Strong sellSellNeutralBuyStrong buy
Oscillators
Neutral
SellBuy
Strong sellStrong buy
Strong sellSellNeutralBuyStrong buy
Summary
Neutral
SellBuy
Strong sellStrong buy
Strong sellSellNeutralBuyStrong buy
Summary
Neutral
SellBuy
Strong sellStrong buy
Strong sellSellNeutralBuyStrong buy
Summary
Neutral
SellBuy
Strong sellStrong buy
Strong sellSellNeutralBuyStrong buy
Moving Averages
Neutral
SellBuy
Strong sellStrong buy
Strong sellSellNeutralBuyStrong buy
Moving Averages
Neutral
SellBuy
Strong sellStrong buy
Strong sellSellNeutralBuyStrong buy
Displays a symbol's price movements over previous years to identify recurring trends.
Frequently Asked Questions
The current price of ARIES is 385.55 INR — it has decreased by −1.33% in the past 24 hours. Watch ARIES AGRO LTD. stock price performance more closely on the chart.
Depending on the exchange, the stock ticker may vary. For instance, on NSE exchange ARIES AGRO LTD. stocks are traded under the ticker ARIES.
ARIES stock has risen by 5.95% compared to the previous week, the month change is a 13.73% rise, over the last year ARIES AGRO LTD. has showed a 27.92% increase.
ARIES reached its all-time high on Dec 13, 2024 with the price of 406.95 INR, and its all-time low was 24.15 INR and was reached on Mar 6, 2009. View more price dynamics on ARIES chart.
See other stocks reaching their highest and lowest prices.
See other stocks reaching their highest and lowest prices.
ARIES stock is 7.49% volatile and has beta coefficient of 1.70. Track ARIES AGRO LTD. stock price on the chart and check out the list of the most volatile stocks — is ARIES AGRO LTD. there?
Today ARIES AGRO LTD. has the market capitalization of 5.02 B, it has increased by 4.26% over the last week.
Yes, you can track ARIES AGRO LTD. financials in yearly and quarterly reports right on TradingView.
ARIES net income for the last quarter is −36.94 M INR, while the quarter before that showed 115.83 M INR of net income which accounts for −131.89% change. Track more ARIES AGRO LTD. financial stats to get the full picture.
Yes, ARIES dividends are paid annually. The last dividend per share was 1.00 INR. As of today, Dividend Yield (TTM)% is 0.26%. Tracking ARIES AGRO LTD. dividends might help you take more informed decisions.
EBITDA measures a company's operating performance, its growth signifies an improvement in the efficiency of a company. ARIES AGRO LTD. EBITDA is 722.82 M INR, and current EBITDA margin is 11.53%. See more stats in ARIES AGRO LTD. financial statements.
Like other stocks, ARIES shares are traded on stock exchanges, e.g. Nasdaq, Nyse, Euronext, and the easiest way to buy them is through an online stock broker. To do this, you need to open an account and follow a broker's procedures, then start trading. You can trade ARIES AGRO LTD. stock right from TradingView charts — choose your broker and connect to your account.
Investing in stocks requires a comprehensive research: you should carefully study all the available data, e.g. company's financials, related news, and its technical analysis. So ARIES AGRO LTD. technincal analysis shows the buy rating today, and its 1 week rating is strong buy. Since market conditions are prone to changes, it's worth looking a bit further into the future — according to the 1 month rating ARIES AGRO LTD. stock shows the buy signal. See more of ARIES AGRO LTD. technicals for a more comprehensive analysis.
If you're still not sure, try looking for inspiration in our curated watchlists.
If you're still not sure, try looking for inspiration in our curated watchlists.