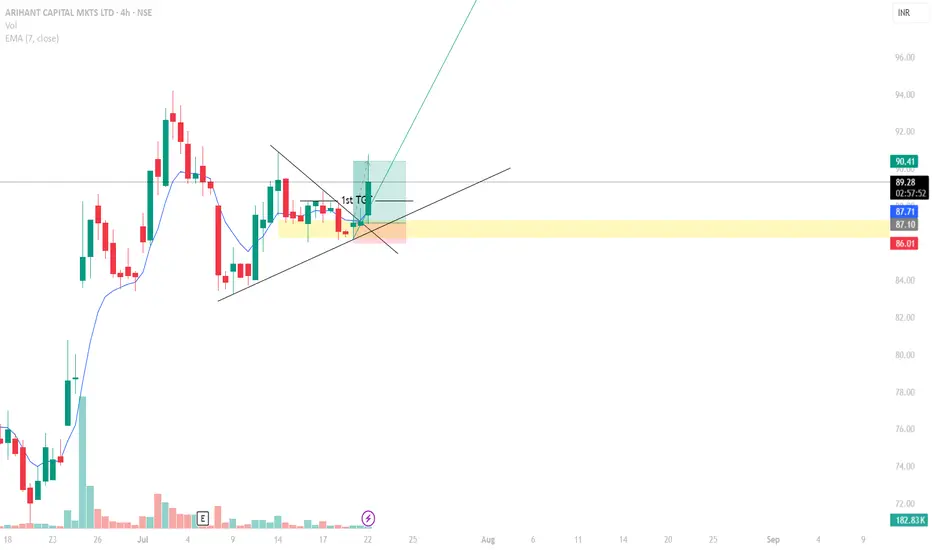
ARIHANT CAPITALSame Strategy!!!
Identified the golden zone and entered the trade.
Risk to Reward ratio of 3:1, booked a profit of Rs. 3 per share.
Although, the profit might seem small, but assume you have 1000 shares of the same stock and you are making Rs. 3000 in just 2 days,
Now you get it,
Its more about
5.05 INR
587.03 M INR
2.48 B INR
24.75 M
About ARIHANT CAPITAL MKTS LTD
Sector
Industry
Website
Headquarters
Mumbai
Founded
1992
ISIN
INE420B01036
FIGI
BBG000DYTWT7
Arihant Capital Markets Ltd. is a holding company, which engages in the provision of financial services. Its services include securities and commodities broking, financial planning, depository services, and merchant banking. The company was founded by Ashok Kumar Jain on June 25, 1992 and is headquartered in Mumbai, India.
Related stocks
ARIHANTCAP CMP 88This stock giving trendline breakout with strong volumes with the confirmation of upper bollinger band breakout.we can take a best swing trade in it with a best risk reward ratio


Arihant capital PositionalPros
- Very long base BO
-Inv H&S
-Huge Volume
-Great results
- Less overhead supply on left side
-High RS
- Stan weinstein's set up

Arihant Capital Markets: (Swing)Arihant Capital Markets (Swing):
Chart of ACM could offer a 25-30 % reward for the upcoming days.
Keep adding at current levels and on any dips with a SL around 68.
Appropriate support, resistance levels are highlighted with target.
RR is around 1:3.
Note: Do your own due diligence before taking

Arihant Capital Markets Ltd. Riding the 5th Wave ImpulseArihant Capital Markets Ltd: Riding the 5th Wave Impulse
Daily Time Frame:
Elliott Wave Analysis: Arihant Capital Markets appears to be in an impulse move on the daily time frame, with completion of wave 4 as a correction.
Current Stage: Unfolding wave 5, with (i) and (ii) completed and a p

Long-ARIHANTCAPALL Time high Arihant capital.
Stoploss 195.
Revise stoploss once it moves to price favour.

Accumulate: Between 86.85 to 65.50 Arihant CapitalBullish Breakout Possible above 87 with 1 day close base
So, Accumulate small small qty between 86.85 to 65.50 Levels
Stop Loss: 60 with 1 day close below it.
One can Plan according to my instructions.
Here Target 1 is 108.20 and then we will review it for further levels.
Risk is yours and Reward

See all ideas
Summarizing what the indicators are suggesting.
Oscillators
Neutral
SellBuy
Strong sellStrong buy
Strong sellSellNeutralBuyStrong buy
Oscillators
Neutral
SellBuy
Strong sellStrong buy
Strong sellSellNeutralBuyStrong buy
Summary
Neutral
SellBuy
Strong sellStrong buy
Strong sellSellNeutralBuyStrong buy
Summary
Neutral
SellBuy
Strong sellStrong buy
Strong sellSellNeutralBuyStrong buy
Summary
Neutral
SellBuy
Strong sellStrong buy
Strong sellSellNeutralBuyStrong buy
Moving Averages
Neutral
SellBuy
Strong sellStrong buy
Strong sellSellNeutralBuyStrong buy
Moving Averages
Neutral
SellBuy
Strong sellStrong buy
Strong sellSellNeutralBuyStrong buy
Displays a symbol's price movements over previous years to identify recurring trends.
Frequently Asked Questions
The current price of ARIHANTCAP is 101.44 INR — it hasn't changed in the past 24 hours. Watch ARIHANT CAPITAL MKTS LTD stock price performance more closely on the chart.
Depending on the exchange, the stock ticker may vary. For instance, on NSE exchange ARIHANT CAPITAL MKTS LTD stocks are traded under the ticker ARIHANTCAP.
ARIHANTCAP stock has risen by 16.58% compared to the previous week, the month change is a 22.22% rise, over the last year ARIHANT CAPITAL MKTS LTD has showed a 23.71% increase.
ARIHANTCAP reached its all-time high on Oct 17, 2024 with the price of 124.80 INR, and its all-time low was 22.25 INR and was reached on Jun 18, 2021. View more price dynamics on ARIHANTCAP chart.
See other stocks reaching their highest and lowest prices.
See other stocks reaching their highest and lowest prices.
ARIHANTCAP stock is 3.88% volatile and has beta coefficient of 1.45. Track ARIHANT CAPITAL MKTS LTD stock price on the chart and check out the list of the most volatile stocks — is ARIHANT CAPITAL MKTS LTD there?
Today ARIHANT CAPITAL MKTS LTD has the market capitalization of 10.56 B, it has increased by 1.49% over the last week.
Yes, you can track ARIHANT CAPITAL MKTS LTD financials in yearly and quarterly reports right on TradingView.
ARIHANTCAP net income for the last quarter is 127.03 M INR, while the quarter before that showed 77.01 M INR of net income which accounts for 64.94% change. Track more ARIHANT CAPITAL MKTS LTD financial stats to get the full picture.
Yes, ARIHANTCAP dividends are paid annually. The last dividend per share was 0.50 INR. As of today, Dividend Yield (TTM)% is 0.49%. Tracking ARIHANT CAPITAL MKTS LTD dividends might help you take more informed decisions.
EBITDA measures a company's operating performance, its growth signifies an improvement in the efficiency of a company. ARIHANT CAPITAL MKTS LTD EBITDA is 655.13 M INR, and current EBITDA margin is 29.78%. See more stats in ARIHANT CAPITAL MKTS LTD financial statements.
Like other stocks, ARIHANTCAP shares are traded on stock exchanges, e.g. Nasdaq, Nyse, Euronext, and the easiest way to buy them is through an online stock broker. To do this, you need to open an account and follow a broker's procedures, then start trading. You can trade ARIHANT CAPITAL MKTS LTD stock right from TradingView charts — choose your broker and connect to your account.
Investing in stocks requires a comprehensive research: you should carefully study all the available data, e.g. company's financials, related news, and its technical analysis. So ARIHANT CAPITAL MKTS LTD technincal analysis shows the buy rating today, and its 1 week rating is strong buy. Since market conditions are prone to changes, it's worth looking a bit further into the future — according to the 1 month rating ARIHANT CAPITAL MKTS LTD stock shows the buy signal. See more of ARIHANT CAPITAL MKTS LTD technicals for a more comprehensive analysis.
If you're still not sure, try looking for inspiration in our curated watchlists.
If you're still not sure, try looking for inspiration in our curated watchlists.