ashokkleyNSE:ASHOKLEY
One Can Enter Now !
Or Wait for Retest of the Trendline (BO) !
Or wait For better R:R ratio !
Note :
1.One Can Go long with a Strict SL below the Trendline or Swing Low.
2. R:R ratio should be 1 :2 minimum
3. Plan as per your RISK appetite and Money Management.
Disclaimer : You are responsible for your Profits and loss, Shared for Educational purpose
ASHOKLEY trade ideas

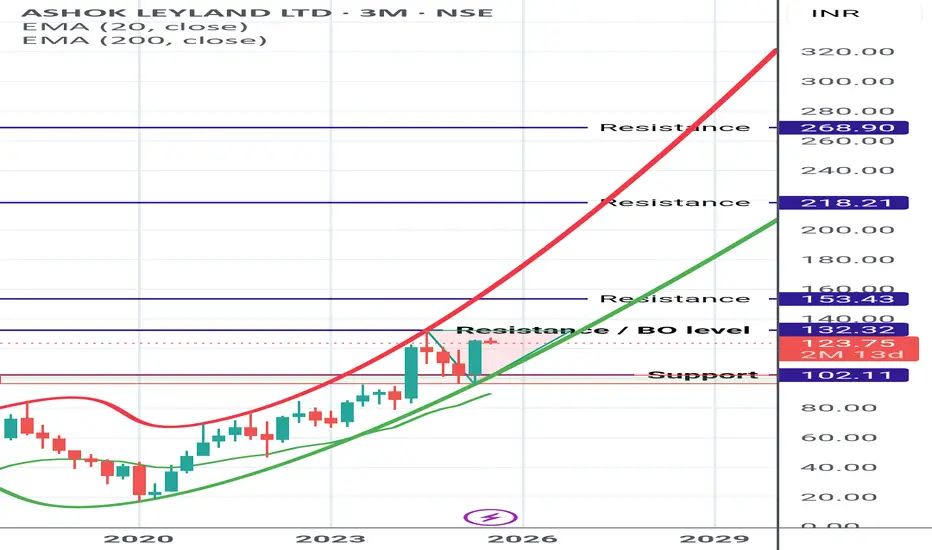
Ashok Ley land updated view Ashok ley land chart updated after price adjustment of bonus.
Currently trading in Parabolic uptrend pattern and inside Triangular zone.
On closing above the triangular marked zone (Breakout level) rest of the marked Resistance can be expected
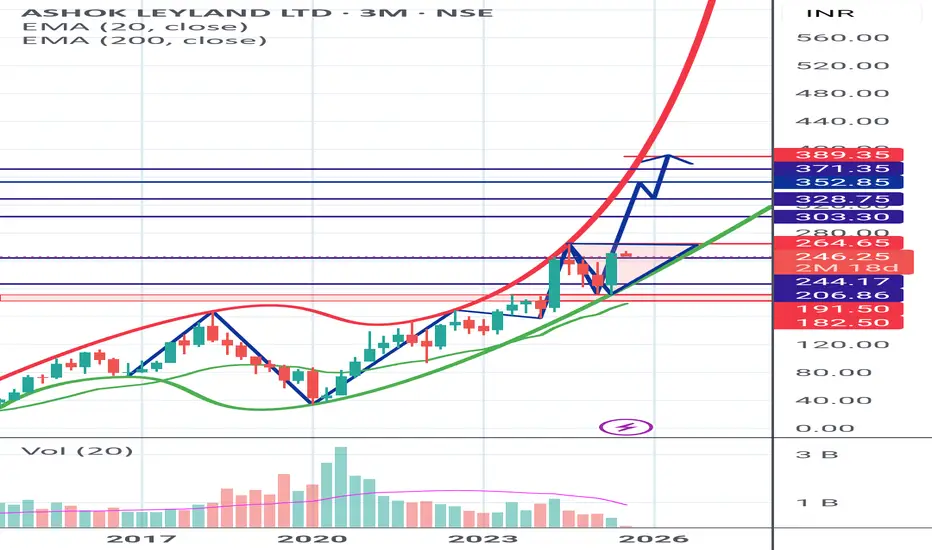
Long Term Investment cum Trading Idea ( FnO Stock)ASHOKLEY LTP 217
Tgt:242/264/295🤞🏻
Long-term: 328/399/432🤞🏻🤞🏻
May add more on dips till 206-191
For investors with a long-term perspective and the ability to add on dips or hold calmly.
Time Frame: 4 to 12 months 🤞🏻
Trade as per your risk management and investment plan.
#luv4stockmarket
#scammersfreetrading
#atmanirbharinvesting

#ASHOKLEY - Pivot Point is 239.47Date: 27-05-2025
Pivot Point: 239.47 Support: 233.96 Resistance: 245.02
Upside Targets:
Target 1: 250.90
Target 2: 256.79
Target 3: 263.29
Downside Targets:
Target 1: 228.057
Target 2: 222.15
Target 3: 215.65
#AshokLeyChartPatterns

Auto stock flag break out!Ashok Leyland daily chart:
The stock was in a descending channel (bull flag), indicating a pullback in a larger uptrend.
It recently had a bullish breakout from the channel with strong momentum, suggesting the bulls are trying to resume the uptrend.
Price is now pulling back to the breakout zone (~231), which is a typical "breakout pullback" setup.
As long as price stays above the support zone (~231), the trend is bullish with a potential target near 255 (measured move).
If the price drops below 214, the breakout may fail, and a deeper correction could follow.
Summary: Bullish breakout with a healthy pullback; watch for a bounce near 231 to confirm continuation toward 255.

Big Pattern Spotted in Future Segment Stock Ashok LeylandSomething exciting is happening with Ashok Leyland Ltd! On the daily linear chart, the stock has been stuck in a range since 2021, forming a complex Bow & Tie pattern. This pattern typically has 7 or 9 waves, and we're now in the final 9th wave, signaling a potential breakout after the completion of the 9th wave. Ashok Leyland could be a great pick on a dip!

Ashokley ,1DPattern is Looking Very Excellent , it is ready to BreakOut the Pattern
just look on this to break the upper trendline
and enter with 3-4% risk and Aim for 20%
This is just my Point of View , Take Risk According to Your Capacity
Follow for More Swing Ideas Like This

Ashok Leyland in weekly timeframeTrendline Support (Post-COVID): Ashok Leyland appears to be testing a key trendline that it has been following since the COVID-19 recovery period. This trendline, has been tested multiple times before, can act as strong support.
Fibonacci 50-61% Retracement (Demand Zone): The stock is currently sitting in the 50-61% Fibonacci retracement zone "golden zone"
The trendline support and Fibonacci retracement levels makes it an ideal zone for bullish setups.

Review and plan for 20th February 2025Nifty future and banknifty future analysis and intraday plan.
Few stocks.
This video is for information/education purpose only. you are 100% responsible for any actions you take by reading/viewing this post.
please consult your financial advisor before taking any action.
----Vinaykumar hiremath, CMT

ASHOKLEY reached nothing to do area @225We will wait till 240, Once price crosses 240 we will get a new high with targets of 260 &285. For now wait as we get a lot of patterns but they will fail and eventually u will end up with losing your SL.

Ashok Leyland towards 300Ashok Leyland has formed cypher pattern.
Weekly close above 233 will confirm this pattern (at 0.5 Fib level)
Weekly close above will take it to 300 with below targets,
250 / 280 / 300

Ashok Leyland is ready for Rocket !! Ashok Leyland is consolidating from last 9 months
Stock is taking support around 190-210 zone
We may see good bounce from hereon
and will see all time highs in days to come
Thank You !!


12 % Up move remaining ASHOK LEYLAND LTD"Everything is pretty much explained in the picture itself.
I am Abhishek Srivastava | SEBI-Certified Research and Equity Derivative Analyst from Delhi with 4+ years of experience.
I focus on simplifying equity markets through technical analysis. On Trading View, I share easy-to-understand insights to help traders and investors make better decisions."
For any query kindly dm.
Thank you So Much.

Inverted head and shoulder on $ASHOKLEYNSE:ASHOKLEY
The chart shows that a beautiful inverted head-and-shoulders pattern has been formed on $NSE:ASHOKLEY.
Before pattern formation, there was a downtrend in the stock.
This is a reversal pattern.
Some of the key ratios:
ROCE: 15.0 %
ROE: 28.4 %
RoA: 4.42 %
EPS: 8.95
Stock P/E: 25.5
Industry PE: 18.8
PEG Ratio: 6.30
Disc -
1. I don't have a position in it yet, but I will build one today.
2. For educational purposes only.

ASHOKLEY NSE BULLISH FLAG&POLE DTF/WTF SWING/POSITIONAL ASHOKLEY NSE Stock Analysis
Trade Plan:
Entry: 50% of the total quantity at 216 DTF Close, with an additional 50% added at 242 DTF Close Price.
Stop Loss: 201
Target SWING: 264 ATH ,
Target 1: 275
Target 2: 310
Hold for a period of SIX months to TWO year or until the target 2 is reached.
Chart Pattern:
The stock had a nearly Four Month Bullish Run and now Retraced to 50% FIOBR in about a month Forming a Bullish Flag and Pole Pattern ,during the bull run it touched an all-time high (ATH) of 264. The Flag structure has been broken on the upside with a strong bullish candle a couple of days ago and a fair retracement yesterday.
Technical Indicators:
The stock’s daily timeframe (DTF) shows that the price is currently trading above the 20-day exponential moving average (EMA) and below the 50-day EMA. The EMAs are in Transition stage of alignment. A potential bullish trend in formation on the DTF/WTF timeframe.
Volume Analysis:
There has been a surge up of volumes on the buy side for a few weeks now. There Decline in the sell volume indicating a potential reversal shortly.
Prioritize Watch List:
Keep this stock in your watch list for further analysis and potential trading opportunities.
Disclaimer: This information is solely for educational and reference purposes. Trading inherently carries risks, and it’s crucial to exercise caution and conduct comprehensive research before making any investment decisions. Make sure you have a well-defined risk appetite, proper position sizing, and a stop-loss order based on your risk tolerance. Review your Portfolio periodically. Exit positions when the price closes 7-8% below your entry point or Earlier basis your Risk profile. Consider re-entering the market when the trend reverses.Before engaging in any trading activities, it is paramount to thoroughly comprehend these technical analysis concepts and conduct extensive research on the stocks you are interested in. Furthermore, consulting a certified financial advisor can offer valuable insights and guidance before making investment decisions.
Technical Analysis Concepts:
Multiple Time Frame Analysis (MTFA):
Daily Time Frame (DTF): Used for short-term analysis and identifying trends.
Weekly Time Frame (WTF): Provides a broader perspective and helps in trend confirmation.
Monthly Time Frame (MTF): Ideal for long-term analysis and trend analysis.
All-Time High (ATH): The highest price reached on a specific chart.
Lifetime High (LTH): The highest price reached over the entire chart’s history.
Stop Loss (SL): A predetermined price level at which an investment is automatically exited to limit potential losses.
Swing Trade: A trading strategy that involves holding positions for a significant period, typically few weeks to months.
Positional Trade: A trading strategy that aims to capitalize on long-term trends and position oneself accordingly.
CHART PATTERNS
Rounding Bottom Cup/Handle (RBC&H): A pattern that signals a potential reversal from a downtrend.
Breakout (BO): A price move closure above a resistance or below a support level.
Flag & Pole BO: (F&P BO) Bullish Continuation Pattern
Consolidation : Price Typically Swings between a Range for a period of Time Long or Short basis the MTFA. Breaking out of this range UPWARDS is an opportunity to BUY and DOWNWARDS is SELL opportunity.
Moving Averages:
Exponential Moving Average (EMA): A popular moving average that places more weight on recent price data.
Volume-Weighted Moving Average (VWMA): A moving average that gives more weight to high-volume stocks.
Fibonacci Retracement/Extension:
Trend-based Fibonacci Retracement: Used to identify potential support and resistance levels during re-tracements.
Trend-based Fibonacci Extension: Used to identify potential breakout levels during extensions.

ONE OF THE BEST REVERSAL PATTERNASHOK LEYLAND LTD seems bullish now *S/*R are drawn, on the basis of this you can decide what to do.

Ashoklay : bought on July 2020 at cmp: 51 Qty: 1450 73k/-bought on July 2020 at cmp: 51
Qty: 1450
73k/-
Now today on Nov 2024
Profit: + 2.4 lcs \- :)
+335% growth

ASHOKLEY NSEASHOKLEY is in a bullish trend and has corrected @60% from its ATH of 264, currently in trading in a range with flat volumes. its trading between 50 & 61% FIBO. A flag and Pole Structure
Entry above 242 Day close, Entry with 25% qty on breakout and balance when retest is done, Target 1 264 and TGT 2-275, maintain SL 233.

Analysis for Ashok Leyland
Price has formed a Fresh Monthly Supply which is a Source
We have a fresh Quarterly Demand which is a Destination for the downtrend.
We have divided the Supply to Demand Equilibrium into 5 parts giving us an understanding of where are we on the Curve.
Price reacted to the Monthly Source Supply and has violated its previous low which confirms the momentum in the downward direction. Now we have a fresh Supply formed in Weekly chart which is a trade Supply.
This a Short position for Reward of 3 against risk of 1.

F&O - Ashok Leyland- Slopping Trendline #BreakoutStock
- Price failed to create new low
- Volume Pop
📌 Above 241 #stock looking good for upside 📈

ASHOKLEY - Swing Long SetupEnter only when 15minute candle closes above the Entry Zone Price - 247.90
Target with Risk to reward 1:2 is 263.40
Stoploss only when 1 day candle closes below the price - 240.15
Note: This is not any financial advice, this is for education purpose only.
