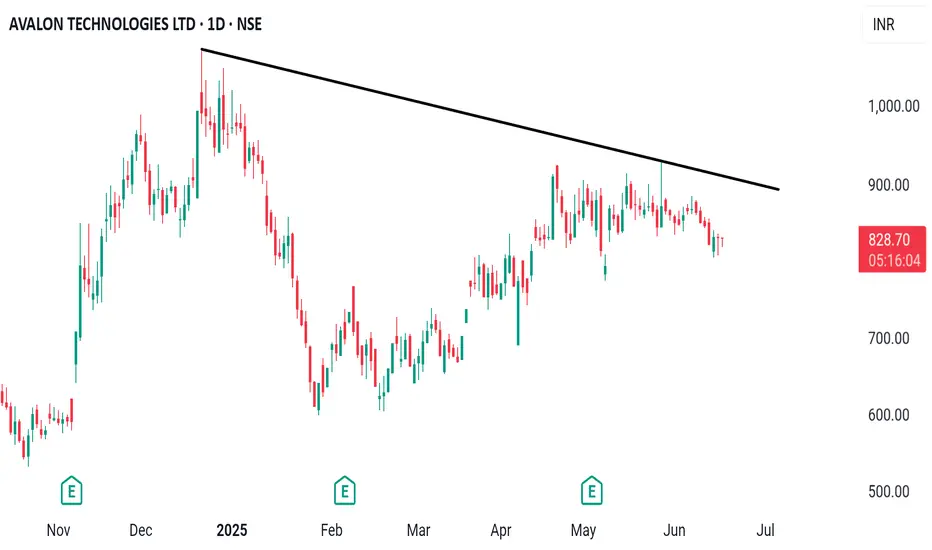
Trendline brakeout patternsU can simply see trendline neat ath
Consolidation near trendline means buyers seller accumulated
If bo get it will get move.
AVALON trade ideas
AVALON CMP 811.On daily timeframe stock trading above all EMA 10,20,50.Looking bullish for short term.Risk Reward is best Possible coming target 850,.......900,......950.Always keep stoploss.Because market is unpredictable .Thanks.

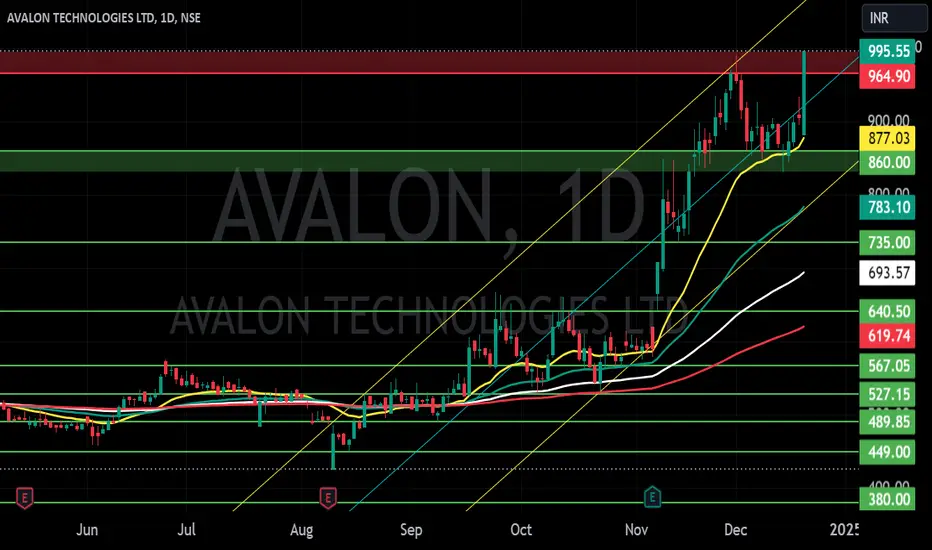
AVALON TECHNOLOGIES LTD S/R Support and Resistance Levels:
Support Levels: These are price points (green line/shade) where a downward trend may be halted due to a concentration of buying interest. Imagine them as a safety net where buyers step in, preventing further decline.
Resistance Levels: Conversely, resistance levels (red line/shade) are where upward trends might stall due to increased selling interest. They act like a ceiling where sellers come in to push prices down.
Breakouts:
Bullish Breakout: When the price moves above resistance, it often indicates strong buying interest and the potential for a continued uptrend. Traders may view this as a signal to buy or hold.
Bearish Breakout: When the price falls below support, it can signal strong selling interest and the potential for a continued downtrend. Traders might see this as a cue to sell or avoid buying.
MA Ribbon (EMA 20, EMA 50, EMA 100, EMA 200) :
Above EMA: If the stock price is above the EMA, it suggests a potential uptrend or bullish momentum.
Below EMA: If the stock price is below the EMA, it indicates a potential downtrend or bearish momentum.
Trendline: A trendline is a straight line drawn on a chart to represent the general direction of a data point set.
Uptrend Line: Drawn by connecting the lows in an upward trend. Indicates that the price is moving higher over time. Acts as a support level, where prices tend to bounce upward.
Downtrend Line: Drawn by connecting the highs in a downward trend. Indicates that the price is moving lower over time. It acts as a resistance level, where prices tend to drop.
Disclaimer:
I am not a SEBI registered. The information provided here is for learning purposes only and should not be interpreted as financial advice. Consider the broader market context and consult with a qualified financial advisor before making investment decisions.
Postional trade Idea Avalon Technologies Ltd has broken out of a strong resistance zone around ₹700-₹720, rallying to ₹792 with impressive momentum. This breakout, coupled with high volume, signals a potential continuation of the uptrend. A target of ₹850-₹900 looks achievable in the near term if momentum sustains. Stop-loss can be set below ₹700 to manage risk. This setup offers a compelling entry for positional traders eyeing further upside.

50 SMA Rising- Positional TradeDisclaimer: I am not a Sebi registered adviser.
This Idea is publish purely for educational purpose only before investing in any stocks please take advise from your financial adviser.
Its 50 SMA Rising Strategy. Suitable for Positional Trading Initial Stop loss lowest of last 2 candles and keep trailing with 50 days SMA if price close below 50 SMA then Exit or be in the trade some time trade can go for several months.
Be Discipline because discipline is the Key to Success in the STOCK Market.
Trade What you see not what you Think

Cup with handle or rounding buttomAfter a long consolidation price has broke out weekly resistance now it's made small retest and breaks out on daily time frame.volume spike

A short term technical trade weekly TFPrice broken almost year long consolidation with strong volumes....TGT 727 Sl below 549 closing basis....only for educational purpose and not any recommendation...

AVALON SWING TRADE 40% RETUN💯🚀swing trade perfect symmetrical triangle long term opportunity take trade according to own risk this is not call just a analysis.

Avalon Elgi Equipment Daily timeframe analysis for long term
NSE:AVALON has consolidated over 552 range over last 7 month and about to breakout.
We can see long term move above 555 with SL of 525 can average till 535.
Major targets levels are highlighted in blue lines.


AVALONTriangle pattern breakout – the optimal entry point would be at the 509 retrace candle, or alternatively, by placing a wider stop loss. The target is set at the pattern high.

Avalon Technologies LtdIncorporated in 1999, Avalon Technologies Limited is a leading fully integrated Electronic Manufacturing Services ("EMS") company with end-to-end capabilities in delivering box-build solutions, focusing on high-value precision-engineered products

