BAJFINANCE trade ideas


BAJA Symmetrical Triangle 4HRA Symmetrical Triangle is a "bi-lateral" pattern, meaning it could break in either direction.
Our target is the approximate pattern height multiplied by chances of reaching the target or 747.85 * 0.58 = ~433.753 from breakpoint.
Entry: Not ready yet, wait for breakout for direction. wait for full confirmation of 1 bar beyond pattern.
TP: ~433$ from breakpoint
SL: Previous Swing before breakout. Long trade: ~3094$ Short trade: ~3420$
R/R: Will update later after break.
Pattern info: thepatternsite.com

Bajaj Finance ( DAILY ) - Candlestick PatternBAJAJ FINANCE( DAILY )
Candlestick Confirmation
Downtrend from 31st Aug 2020 till 23rd Oct 2020
Indication of Bullish Engulfing with spike in volume and Stochastion in oversold positions
AWAIT FOR BULLISH CANDLE CONFIRMATION
Buy above 3362
Target of 3519


Live Intraday Trading - A intraday trend reversal trade !!Market was trending lower this morning . But , at the same time Bajaj Finance was trending very positive on the last day . As market was trending lower , Bajaj Finance
was also trending lower along with the market . When , the market cooled down a bit , the market started rising higher . At the same time Bajaj Finance stock was also showing some signs to rise higher . Just got into a perfect position and got some handsome profit .

Immediate resistance breakoutView bullish immediate resistance break-
Out possibility long above 3392 with sl 3376

bajfin last 11 year data very interesting bajfin 11-year history this year big profit booking buy long term investors but still has potential to go upside or it can hold a level of 2019 candle range

BAJAJ FINANCE - Expanding Trianglelet me know in the comment section below if you have any questions,
the entry will be taken only if all rules of the strategies will be satisfied.

Bullish Bajaj FinanceBajaj Finance on Short term chart is showing Breakout of Inverse Head and shoulders.
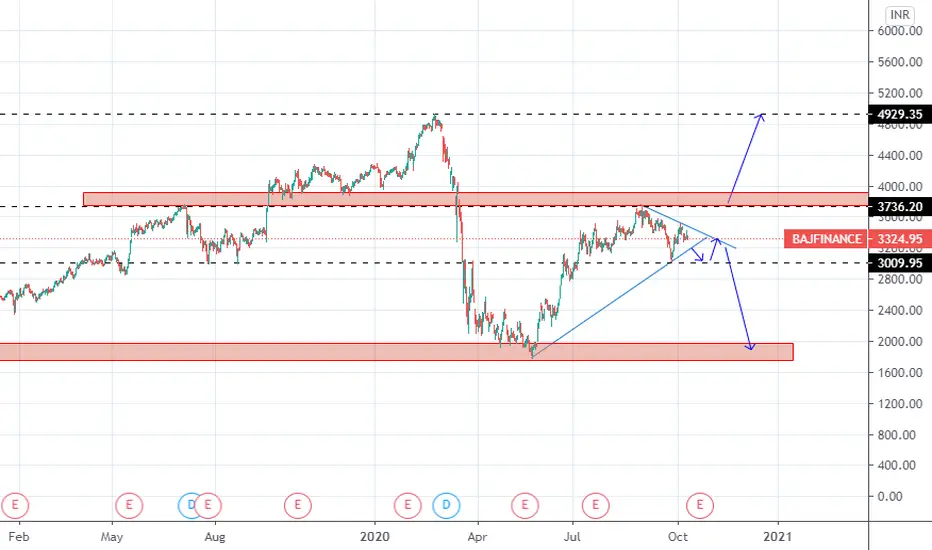
on weekly charts, Stock has moved from 1783 to 3750 and then retraced 38.2% to 3006.9 and showing reversal trend again.till the time stock hold low of 3006.9, can show move till 5000.
PS: chart and view only for purpose of learning, please consult financial advisor before making any investment.


BAJAJ FINANCEBAJAJ FINANCE SHORT TRADE
Baja Finance has broken a key market structure and has hit a support level and is expected to have a massive sell off
Bajaj Finance - OutlookHi Traders,
Bajaj finance is still in a downtrend as per the higher timeframes. This stock has pulled back to a major resistance zone. The price can continue to go further down from these levels. If the price breaks the trendline marked in the chart which will indicate that the price will be heading down. The key levels to watch are marked with red lines in the chart, these levels can react with the price.
Now if price breaks the key resistance zone to the upside, a break above 3590.85 indicates a start of an uptrend.
For queries pls comment below.
Happy trading.....

Bajaj finance bullish Good long candidateBajaj finance spot cmp 3090
Bullish AB= CD pattern formation
PRZ at 3080-3070
pattern violation below 3050 once sustain below this levels for 15 mins

BajajFinance -BearishNow it Don't shows any Strong momentum in uptrend, loosing trend and now it should go down, we could expect till dotted line.


BAJAJ FINANCE POTENTIAL HEAD AND SHOULDERS BUY OPPORTUNITYBAJAJ FINANCE STOCK MAY FORM HEAD AND SHOULDERS FORMATION ON HOURLY CHART. CURRENTLY CHART HAS REACHED AT NECK LINE OF POTENTIAL HEAD AND SHOULDERS FORMATION. WHICH MEANS NEXT MOVE SHOULD BE RETRACEMENT TOWARDS FORMING RIFHT SHOULDER AROUND INR 3200 (EVEN HANDLE NUMBER). AGGRESSIVE TRADERS CAN PLACE THEIR LIMIT ORDER ABOVE INR 3200 MARK, WHERE AS CONSERVATIVE TRADERS CAN WAIT TO RETRACE AROUND LEFT SHOULDER AREA (NEAR 3200) AND ONCE PRICE REACH AT 3200 LOOK FOR REASON TO ENTER LONG.
BUY ENTRY: INR 3180 TO 3140
STOP LOSS: INR 2990
TARGET-1: INR 3350 (RE-TEST OF NECKLINE)
TARGET-2: INR 3560

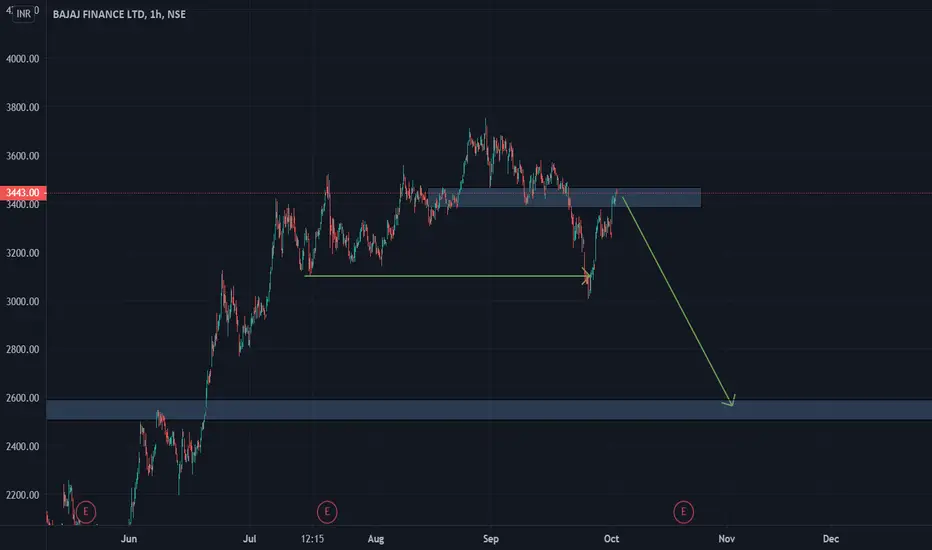
BajajFinance : RetracementClearly We can see downtrend in BajajFinance, it should Retrace Till Dotted Green line, that is as earlier 50% retracement, while one can see pause & pullback at Demand & Supply Zones.
After retracement it should continue its downtrend.


R-0219 Stock Option Buy BAJFINANCE OCT PE 3000.00 @125-129 SShort Term Stock Option Buy BAJFINANCE OCT PE 3000.00 @125-129 SL 92 TGT 195
MACD cross over + TK cross over on bearish side + break support 3170 next support 2850 so GO SHORT
