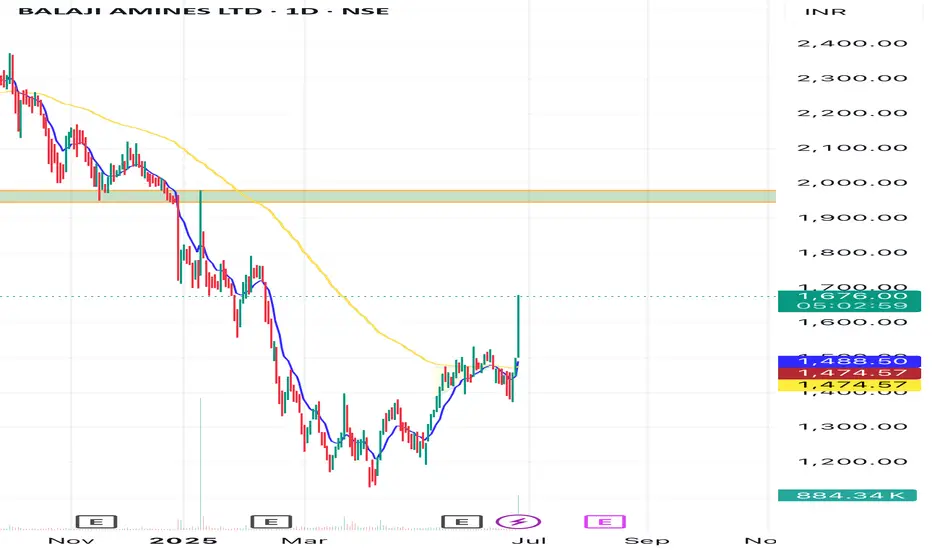
Balaji amines reversal mode?Seems balaji amines on reversal.
Huge volume today..
Need buying volume in coming days.
Can see a profit booking after this big candle..
1900 levels possible..
longterm sluggish momentum
above 100ema barrier..
T1..1900
stop 1400
Balaji Amines Ltd specialises in manufacturing Methylamines, Ethylamine
Next report date
—
Report period
—
EPS estimate
—
Revenue estimate
—
48.60 INR
1.58 B INR
13.91 B INR
8.23 M
About BALAJI AMINES LTD
Sector
Industry
CEO
Ram Reddy Dundurapu
Website
Headquarters
Hyderabad
Founded
1988
ISIN
INE050E01027
FIGI
BBG000CM84T9
Balaji Amines Ltd. engages in the manufacture and sale of specialty chemicals, aliphatic amines, and derivatives. It operates through the following segments: Amines and Specialty Chemicals, Hotel, and CFL Lamps. The company was founded on October 27, 1988 and is headquartered in Hyderabad, India.
Related stocks
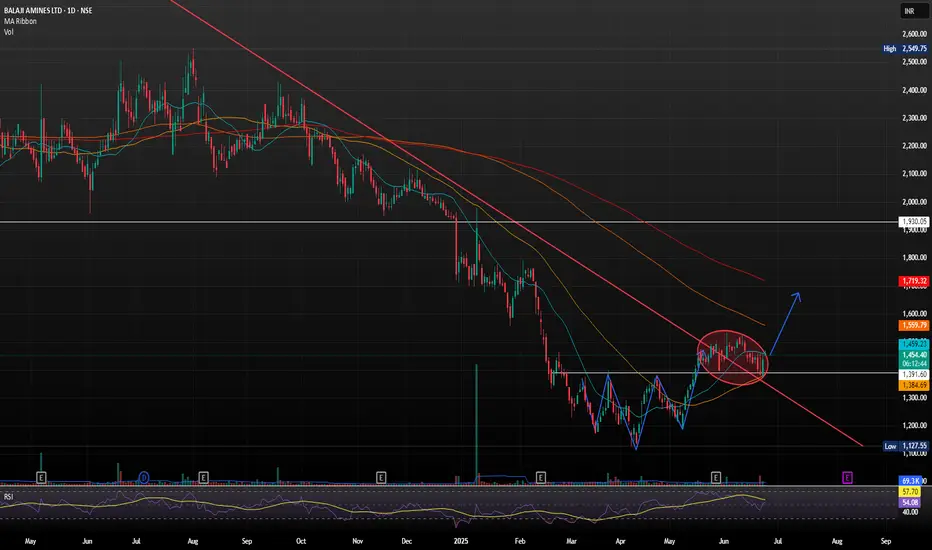
BALAJI AMINES PURE REVERSAL ON CHART.Balaji Amines Ltd. is a leading Indian chemical manufacturing company, primarily engaged in the production of methylamines, ethylamines, and their derivatives, along with specialty chemicals and pharma excipients. It holds a strong position in the aliphatic amines segment and is even the sole produc
SWING IDEA - BALAJI AMINESBalaji Amines , a leading manufacturer of specialty chemicals, is showing promising signs for a potential swing trade.
Reasons are listed below:
Crucial Support Zone (1850-2000) : The 1850-2000 range has proven to be a strong support zone, indicating significant buying interest and potential for

Balaji amines Best time to bye lavel break short term Target Balaji amines shorts Time Target 🎯 2200.2500 best resistance zon

BALAMINES: SUPPORT & RESISTANCE TRADINGBalaji Amines has been trading in a consolidating zone for an extended period, oscillating between well-defined support and resistance levels. This range-bound behavior reflects a lack of decisive directional movement, but also offers an excellent opportunity for range-based trading strategies.
Tec

BALAJI AMINES LTD Trend continuation Disclaimer: I am Not SEBI Registered adviser, please take advise from your financial adviser before investing in any stocks. Idea here shared is for education purpose only.
25.09.2024 Swing paper trade
Buy- CPM
Target- 2341,2380,2448,2549,+++
Stop Loss-2114
#papertrade #learningonly #Swing trade

Balaji amainesGood demand area near 2000
Below 1900 bearish
Balaji Amines Ltd specialises in manufacturing Methylamines, Ethylamines, Derivatives of specialty chemicals and Pharma Excipients.

Balaji Amines Flag Breakout 2XBalaji Amines breakout after 2.26Y. Can expect 2X from current price. Weekly volume is above the average. Daily volume at breakout isn't much convincing. But 15min volume at breakout was good. Maybe for safer side, one can add above 2440. Can wait to retest at breakout maybe around 2350-2360.

Excellent Opportunity in BALAJIAMINESLEVEL MARKED IN THE CHART.
THIS EXCELLENT OPPORTUNITY TO ADD IN PORTFOLIO. We can take a risk of 0.5% of the portfolio and hold the position.

BALAMINES ready for up move.Downtrend is finished and shaking week players by testing their patience before going for a take off.
Entry price b/w 2300 to 2350 looks favourable. Lets wait and watch the play

See all ideas
Summarizing what the indicators are suggesting.
Neutral
SellBuy
Strong sellStrong buy
Strong sellSellNeutralBuyStrong buy
Neutral
SellBuy
Strong sellStrong buy
Strong sellSellNeutralBuyStrong buy
Neutral
SellBuy
Strong sellStrong buy
Strong sellSellNeutralBuyStrong buy
An aggregate view of professional's ratings.
Neutral
SellBuy
Strong sellStrong buy
Strong sellSellNeutralBuyStrong buy
Neutral
SellBuy
Strong sellStrong buy
Strong sellSellNeutralBuyStrong buy
Neutral
SellBuy
Strong sellStrong buy
Strong sellSellNeutralBuyStrong buy
Displays a symbol's price movements over previous years to identify recurring trends.
Frequently Asked Questions
The current price of BALAMINES is 1,681.50 INR — it has decreased by −3.45% in the past 24 hours. Watch BALAJI AMINES LTD stock price performance more closely on the chart.
Depending on the exchange, the stock ticker may vary. For instance, on NSE exchange BALAJI AMINES LTD stocks are traded under the ticker BALAMINES.
BALAMINES stock has fallen by −6.84% compared to the previous week, the month change is a 11.42% rise, over the last year BALAJI AMINES LTD has showed a −25.46% decrease.
We've gathered analysts' opinions on BALAJI AMINES LTD future price: according to them, BALAMINES price has a max estimate of 2,331.00 INR and a min estimate of 1,612.00 INR. Watch BALAMINES chart and read a more detailed BALAJI AMINES LTD stock forecast: see what analysts think of BALAJI AMINES LTD and suggest that you do with its stocks.
BALAMINES reached its all-time high on Sep 15, 2021 with the price of 5,223.55 INR, and its all-time low was 9.25 INR and was reached on Feb 18, 2009. View more price dynamics on BALAMINES chart.
See other stocks reaching their highest and lowest prices.
See other stocks reaching their highest and lowest prices.
BALAMINES stock is 4.20% volatile and has beta coefficient of 1.53. Track BALAJI AMINES LTD stock price on the chart and check out the list of the most volatile stocks — is BALAJI AMINES LTD there?
Today BALAJI AMINES LTD has the market capitalization of 54.37 B, it has decreased by −5.13% over the last week.
Yes, you can track BALAJI AMINES LTD financials in yearly and quarterly reports right on TradingView.
BALAJI AMINES LTD is going to release the next earnings report on Aug 2, 2025. Keep track of upcoming events with our Earnings Calendar.
BALAJI AMINES LTD revenue for the last quarter amounts to 3.53 B INR, despite the estimated figure of 3.60 B INR. In the next quarter, revenue is expected to reach 3.83 B INR.
BALAMINES net income for the last quarter is 400.62 M INR, while the quarter before that showed 331.86 M INR of net income which accounts for 20.72% change. Track more BALAJI AMINES LTD financial stats to get the full picture.
Yes, BALAMINES dividends are paid annually. The last dividend per share was 11.00 INR. As of today, Dividend Yield (TTM)% is 0.66%. Tracking BALAJI AMINES LTD dividends might help you take more informed decisions.
BALAJI AMINES LTD dividend yield was 0.91% in 2024, and payout ratio reached 22.63%. The year before the numbers were 0.54% and 17.40% correspondingly. See high-dividend stocks and find more opportunities for your portfolio.
As of Jul 27, 2025, the company has 1.17 K employees. See our rating of the largest employees — is BALAJI AMINES LTD on this list?
EBITDA measures a company's operating performance, its growth signifies an improvement in the efficiency of a company. BALAJI AMINES LTD EBITDA is 2.32 B INR, and current EBITDA margin is 16.96%. See more stats in BALAJI AMINES LTD financial statements.
Like other stocks, BALAMINES shares are traded on stock exchanges, e.g. Nasdaq, Nyse, Euronext, and the easiest way to buy them is through an online stock broker. To do this, you need to open an account and follow a broker's procedures, then start trading. You can trade BALAJI AMINES LTD stock right from TradingView charts — choose your broker and connect to your account.
Investing in stocks requires a comprehensive research: you should carefully study all the available data, e.g. company's financials, related news, and its technical analysis. So BALAJI AMINES LTD technincal analysis shows the neutral today, and its 1 week rating is neutral. Since market conditions are prone to changes, it's worth looking a bit further into the future — according to the 1 month rating BALAJI AMINES LTD stock shows the sell signal. See more of BALAJI AMINES LTD technicals for a more comprehensive analysis.
If you're still not sure, try looking for inspiration in our curated watchlists.
If you're still not sure, try looking for inspiration in our curated watchlists.