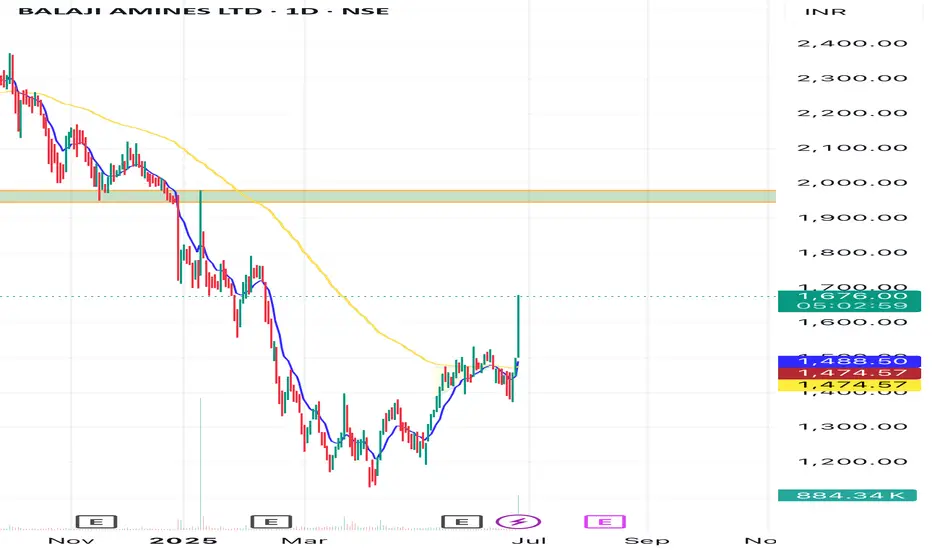
Balaji amines reversal mode?Seems balaji amines on reversal.
Huge volume today..
Need buying volume in coming days.
Can see a profit booking after this big candle..
1900 levels possible..
longterm sluggish momentum
above 100ema barrier..
T1..1900
stop 1400
Balaji Amines Ltd specialises in manufacturing Methylamines, Ethylamines, Derivatives of specialty chemicals and Pharma Excipients. These have been the main products, it also have facilities for the manufacturing of derivatives, which are down-stream products for various pharma/pesticide industries apart from user specific requirements. It is one of the largest manufacturers of aliphatic amines in India
BALAMINES trade ideas
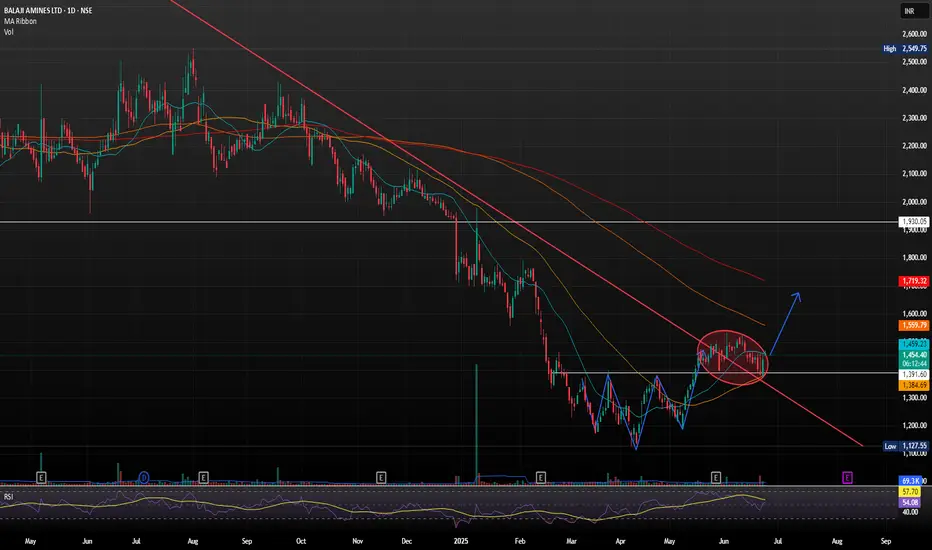
BALAJI AMINES PURE REVERSAL ON CHART.Balaji Amines Ltd. is a leading Indian chemical manufacturing company, primarily engaged in the production of methylamines, ethylamines, and their derivatives, along with specialty chemicals and pharma excipients. It holds a strong position in the aliphatic amines segment and is even the sole producer of certain specialty chemicals in India.
INVERSE HEAD & SHOULDER BREAKOUT AND CONSOLIDATION AT PULLBACKS SHOWS STRONG MOMENTUM FOR UPWARDS
A breakout above 1486 could trigger momentum toward 1524 and beyond towards 1775-1906
On the downside, keep an eye on support near 1330–1358.
SWING IDEA - BALAJI AMINESBalaji Amines , a leading manufacturer of specialty chemicals, is showing promising signs for a potential swing trade.
Reasons are listed below:
Crucial Support Zone (1850-2000) : The 1850-2000 range has proven to be a strong support zone, indicating significant buying interest and potential for a price rebound.
0.618 Fibonacci Support : The price has found support at the 0.618 Fibonacci retracement level, often referred to as the "golden ratio," suggesting a likely reversal or continuation of the uptrend.
Bullish Marubozu Candle on Weekly Timeframe : The recent weekly candle is a bullish marubozu, characterized by little to no shadows, indicating strong buying pressure and potential for further upward movement.
Support from 50 and 200 EMA on Weekly Timeframe : The stock is trading above both the 50-week and 200-week exponential moving averages, providing strong support and confirming the long-term uptrend.
Increase in Volumes : A noticeable spike in trading volume often confirms the strength of a price move, indicating greater participation and confidence in the direction of the trend.
Target - 2720 // 3030 // 3800
Stoploss - weekly close below 1875
DISCLAIMER -
Decisions to buy, sell, hold or trade in securities, commodities and other investments involve risk and are best made based on the advice of qualified financial professionals. Any trading in securities or other investments involves a risk of substantial losses. The practice of "Day Trading" involves particularly high risks and can cause you to lose substantial sums of money. Before undertaking any trading program, you should consult a qualified financial professional. Please consider carefully whether such trading is suitable for you in light of your financial condition and ability to bear financial risks. Under no circumstances shall we be liable for any loss or damage you or anyone else incurs as a result of any trading or investment activity that you or anyone else engages in based on any information or material you receive through TradingView or our services.
@visionary.growth.insights

Balaji amines Best time to bye lavel break short term Target Balaji amines shorts Time Target 🎯 2200.2500 best resistance zon

BALAMINES: SUPPORT & RESISTANCE TRADINGBalaji Amines has been trading in a consolidating zone for an extended period, oscillating between well-defined support and resistance levels. This range-bound behavior reflects a lack of decisive directional movement, but also offers an excellent opportunity for range-based trading strategies.
Technical Analysis:
The stock has recently touched its support level for the 7th time, indicating a strong demand zone at this level.
The repeated testing of support without a significant breakdown strengthens the case for a potential bounce.
Key support: ₹ 1990-2000
Key resistance: ₹ 2441-2550
Trade Setup:
Entry: Near the support level around ₹1990-2000.
Target: ₹2441-2550, the upper boundary of the consolidation range.
Stop Loss: Below the support level, to minimize risk if the support fails.
Disclaimer: This analysis is for educational purposes only. Conduct thorough research or consult a financial advisor before making trading decisions.

BALAJI AMINES LTD Trend continuation Disclaimer: I am Not SEBI Registered adviser, please take advise from your financial adviser before investing in any stocks. Idea here shared is for education purpose only.
25.09.2024 Swing paper trade
Buy- CPM
Target- 2341,2380,2448,2549,+++
Stop Loss-2114
#papertrade #learningonly #Swing trade
1.Breakout- Trend line continuation
2.Volume- Rise in average volume
3. RSI-Bullish
4. Chart Pattern- moving forword with trend line.
News:- Balaji Amines: Betting on new projects in FY 2024-25
Methylamines, Electronic Grade DMC, DME, N-Meth...

Balaji amainesGood demand area near 2000
Below 1900 bearish
Balaji Amines Ltd specialises in manufacturing Methylamines, Ethylamines, Derivatives of specialty chemicals and Pharma Excipients.

Balaji Amines Flag Breakout 2XBalaji Amines breakout after 2.26Y. Can expect 2X from current price. Weekly volume is above the average. Daily volume at breakout isn't much convincing. But 15min volume at breakout was good. Maybe for safer side, one can add above 2440. Can wait to retest at breakout maybe around 2350-2360.

Excellent Opportunity in BALAJIAMINESLEVEL MARKED IN THE CHART.
THIS EXCELLENT OPPORTUNITY TO ADD IN PORTFOLIO. We can take a risk of 0.5% of the portfolio and hold the position.

BALAMINES ready for up move.Downtrend is finished and shaking week players by testing their patience before going for a take off.
Entry price b/w 2300 to 2350 looks favourable. Lets wait and watch the play

Get Ready for BIg Bullish in BALAJI AMINES ! Coming soon!The Trend Looks to be range bound in box from long time and Also volume indicator shows high accumulation has been done. Soon bullish movement is possible. Let us wait and see. Have Patience in these kind of chemical stocks :D

Balaji Amines on the way of sky rocketing Here on chart, you can easily check that it had broke the trendline on Friday @ 2348 level, now it will fly towards upside soon. Crucial Levels are:
1st Target - Rs 2700
2nd Target - Rs 3500
3rd Target - Rs 5000
Stoploss - Rs 2000
Note - Please consult your financial advisor before taking any trade in Balaji Amines

BALAJI AMININESThis Stock is having a Price range squeeze form 2022. Probability of having a range breakout is high. Bullish breakout or Bearish Breakout is possible.
Having Higher quarterly growth. And Government Policy on Chemical Sector GST. Possibility of moving higher is there.

BALAJI AMINESPOSITIONAL SCRIPT
Looking good to hold positionally, having good base formation from past few months, having good risk reward ratio
DISCLAIMER : Sharing views for Study Purpose, no BUY/SELL recommendation

2 year trendline breakout Balajiamines on weekly chart nearly to break a 2 year trendline if closes above
2435.Short term target is 2700.Medium term targets will 3000 and 3400 if closes above 2435.

Balaji amines looking good for targets of 4000+Balaji amines formed strong base in monthly time frame, breaking bearish trend line. targets and stop loss mentioned on chart itself. Holding period 1 years+.

Balaji Amines looking good after a long time. Balaji Amines Ltd., INDIA is an ISO 9001: 2015 certified company, specialised in manufacturing Methylamines, Ethylamines, Derivatives of Specialty Chemicals and Pharma Excipients. These have been their main products, they additionally manufacture derivatives, which are downstream products for various Pharma /Pesticide industries apart from user specific requirements.
Negative aspects of the company are de-growth in revenue and profit and high PE 42.1. Positive aspects of the company are low debt, net cash flow from operating activities increasing, MFs increasing stake and Zero promoter pledge.
Entry can be taken after closing above 2428. Targets in the stock will be 2493 and 2553. The long-term target in the stock will be 2588 and 2600+. Stop loss in the stock should be maintained at Closing below 2130.
The above information is provided for educational purpose, analysis and paper trading only. Please don't treat this as a buy or sell recommendation for the stock. We do not guarantee any success in highly volatile market or otherwise. Stock market investment is subject to market risks which include global and regional risks. We will not be responsible for any Profit or loss that may occur due to any financial decision taken based on any data provided in this message.

Balaji Amines LongBuy Balaji Amines @ CMP
for the Target of 2637-2771-2905-3039
SL 2180
Strategy : Breaking channel and taking Retracement
Duration few Days

Balaji Amines Ltd bottoming outJust look at the setup on monthly chart
First strong upside move, then low volume retracement upto 61% .
Here price takes support of 50 MA and gives breakout of multi month trendline resistance with huge volume.
RSI also closed above 50.
Guess the next move in coming months 🙂
Support = 2330
Deep Support = below 2000
Resistance = 2700, 3100, 3300
Disclaimer: I may be holding position. I am Not SEBI Registered. Chart shared for Educational Purpose only. Kindly do your own analysis before taking Position.

BALAMINESStock name = Balaji Amines Limited.
Weekly chart setup
Chart is self explanatory. Levels of breakout, possible up-moves (where stock may find resistances) and support (close below which, setup will be invalidated) are clearly defined.
Disclaimer: This is for demonstration and educational purpose only. this is not buying and selling recommendations. I am not SEBI registered. please consult your financial advisor before taking any trade.

Triangle BreakoutThe stock has broken a Triangle pattern with 10x volumes. Currently its at retracement price of 2543. 1st Target of 3798, 2nd Target of 4744

Balaji Amines Ltd. Elliott Wave Analysis - Weekly LogarithmicBalaji Amines Ltd. Elliott Wave Analysis - Weekly Logarithmic Chart
The analysis is based on a weekly time frame using a logarithmic chart for Balaji Amines Ltd. The Elliott Wave count reveals a fascinating pattern that can provide insights into potential future price movements. However, it's essential to remember that all trading involves risk, and past performance does not guarantee future results. Always conduct thorough research and consider the inherent uncertainties in financial markets.
Wave Count:
Wave 1 (Nov 2010):
The first wave appears to have completed in November 2010, closing at 57.85. This initial bullish move signaled the beginning of an upward trend.
Wave 2 ABC Correction (Aug 2013):
A corrective ABC pattern followed, completing in August 2013 with a low of 28.05. This retracement set the stage for the next bullish wave.
Wave 3 (Jan 2018):
Wave 3 unfolded with remarkable strength, reaching its peak in January 2018 at a high price of 782. This phase demonstrated the powerful momentum characteristic of third waves.
Target for Wave (3):
The projected target for Wave 3 is at 10267, based on traditional Elliott Wave analysis, indicating the potential magnitude of the bullish move.
Wave 4 ABC Correction (Mar 2020):
The onset of the COVID-19 crash marked the completion of an ABC correction for wave 4, concluding in March 2020 with a low of 200. The market's response to the pandemic created a significant correction.
Wave 5 (Sep 2021):
Wave 5, the final wave of smaller degree, reached its zenith in September 2021, with the stock achieving a high of 5223.55. This completed the five waves of minor degree, establishing a primary degree (1) in September 2021.
Current Scenario:
Post the completion of Wave 5, the stock transitioned into a bearish phase, undergoing an ABC correction near 1880 with a retracement exceeding 61.8%. This correction suggests a significant pullback, indicating a potential change in the overall trend.
Invalidation Level:
The bullish scenario would be invalidated if the stock price falls below the critical level of 1880, signaling potential weakness in the overall Elliott Wave structure.
Disclaimer:
This Elliott Wave analysis is speculative and based on historical price movements. Market dynamics can change, and unforeseen events may impact stock prices. It's crucial for investors to conduct their own research, consider multiple factors, and, if necessary, consult with financial professionals before making any investment decisions. Trading and investing always involve risks, and past performance is not indicative of future results.

Beautiful breakout in #BALAMINES#BALAMINES
Beautiful breakout in Balaji Amines Ltd.
₹2470-₹2450 zone will be a nice level to buy if there is correction.
Can target 50-60% returns after entry zone is tapped!
