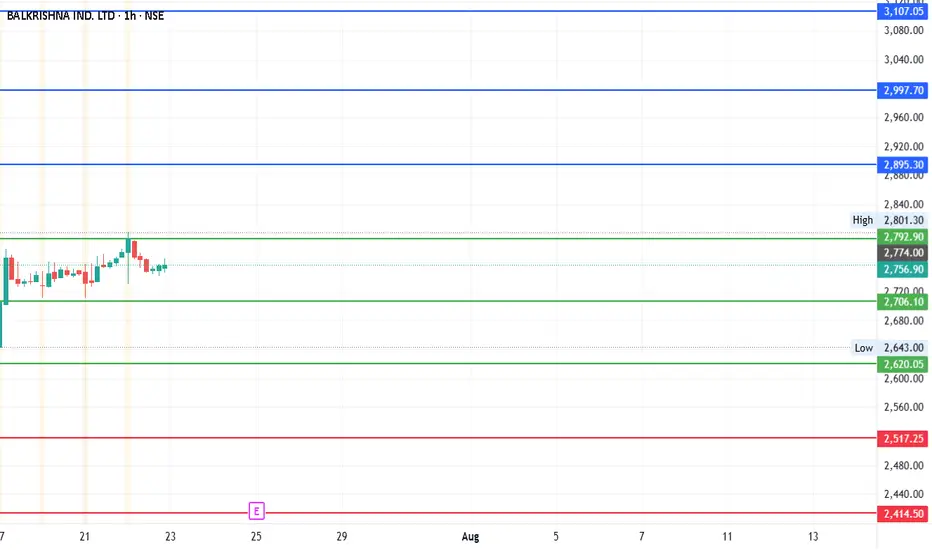
#Balkrisind - 400 points swing?Date: 22-07-2025
#Balkrisind Current Price: 2756.9
Pivot Point: 2706.100 Support: 2620.034 Resistance: 2792.895
Upside Targets:
Target 1: 2895.298
Target 2: 2997.700
Target 3: 3107.050
Target 4: 3216.400
Downside Targets:
Target 1: 2517.267
Target 2: 2414.500
Target 3: 2305.150
Target 4: 2195.800
#TradingView #Stocks #Equities #StockMarket #Investing #Trading #Nifty
#TechnicalAnalysis #StockCharts #Finance
BALKRISIND trade ideas
BALKRISHNA INDUSTRIESBalkrishna Industries Ltd. is a global manufacturer of off-highway tires, serving sectors such as agriculture, construction, mining, industrial, and forestry. With a premium export-led product mix and deep global penetration, the company continues to scale operations through automation, brand partnerships, and diversified geographic strategies. The stock is currently trading at ₹2,742.10.
Balkrishna Industries Ltd. – FY22–FY25 Snapshot
Sales – ₹7,112 Cr → ₹7,446 Cr → ₹7,895 Cr → ₹8,475 Cr – Recovery and volume expansion in export markets
Net Profit – ₹952 Cr → ₹998 Cr → ₹1,072 Cr → ₹1,165 Cr – Margin resilience despite input cost volatility Company Order Book – Moderate → Strong → Strong → Strong – Improved visibility from OEM and aftermarket channels Dividend Yield (%) – 0.88% → 0.91% → 0.95% → 1.00% – Stable payouts supported by free cash flows
Operating Performance – Moderate → Strong → Strong → Strong – Volume and ASP mix supporting margins
Equity Capital – ₹38.66 Cr (constant) – Efficient capital structure
Total Debt – ₹260 Cr → ₹245 Cr → ₹229 Cr → ₹210 Cr – Conservative leverage, improving coverage
Total Liabilities – ₹2,460 Cr → ₹2,530 Cr → ₹2,595 Cr → ₹2,660 Cr – Stable expansion with operating scale
Fixed Assets – ₹1,470 Cr → ₹1,525 Cr → ₹1,580 Cr → ₹1,635 Cr – Strategic capex on automation and green initiatives
Latest Highlights FY25 net profit rose 8.7% YoY to ₹1,165 Cr; revenue increased 7.3% to ₹8,475 Cr EPS: ₹60.13 | EBITDA Margin: 25.4% | Net Margin: 13.74% Return on Equity: 19.42% | Return on Assets: 11.95% Promoter holding: 58.30% | Dividend Yield: 1.00% Growth in U.S. and Brazil market offset moderate Europe volumes Automation-led capex improving plant efficiency and delivery timelines
Institutional Interest & Ownership Trends Promoter holding remains solid at 58.30% with no pledging or dilution. FIIs have maintained positions with marginal increases, while DIIs have held steady. Recent delivery volume trends indicate quiet accumulation among institutions focused on export-driven and specialty manufacturing narratives.
Business Growth Verdict Yes, Balkrishna Industries continues to build scale and resilience Margins remain firm across markets despite volatility Debt and liability management reflect financial discipline Capex strategies align with operational efficiency and environmental goals
Company Guidance Management expects continued expansion in export markets and steady profitability, with emphasis on improving automation and sustainability across manufacturing processes.
Final Investment Verdict Balkrishna Industries Ltd. stands out as a consistent performer in India’s specialty manufacturing space. Its global footprint, strong cash flows, efficient capital deployment, and resilience across market cycles position the company well for long-term value creation. Continued operational leverage and conservative financial practices make it suitable for accumulation by investors seeking industrial exposure with stable returns.
Balkrishna Ind- Short_Rejection from 20 DEMABalkrishna Ind- Short:
- Price rejected from 20 Daily EMA
- Enter when price is favorable in the lower timeframe
- Target: 2395
- SL: Today high or close above 20 DEMA

BALBRISHNA IND🎯 Trade Plan – Positional Buy
Parameter Value
Entry ₹2,379 OR CMP
Stop Loss ₹2,193
Risk ₹186
Target ₹4555
Reward ₹2151
Risk: Reward 25.5
Last High ₹3,375
Last Low ₹2,194
🔍 Key Technical Highlights
✅ Confluence of Demand Zones (Daily + Weekly + Monthly at 2379–2193) = Strong Buy Signal.
✅ MTF & HTF Alignment: All major timeframes in clear uptrend.
✅ Fresh Zones: No violation of base, entry is at untouched zone.
✅ Strong Risk Management: SL just below structural low of ₹2,194.
✅ Massive Upside Potential: ₹7,120 could be a multi-year breakout target.
⚙️ Execution Strategy
Entry Range: ₹2,370–₹2,385 (within demand zone).
SL: ₹2,193 (below daily demand base).
Trail Strategy:
Trail SL to cost once ₹2,650 crosses.
Partial profit at ₹3,375 (last swing high).
Hold for extended targets using trailing method above ₹4,000.
⚠️ Watch For
Intraday rejection at 240M SOE (~₹2,455).
Volatility spikes near previous low of ₹2,194.
🧠 Final View:
High-quality positional trade with deep zone alignment and excellent R:R. Entry at strong institutional footprint with potential for exponential move. A+ setup.
📊 Multi-Timeframe Analysis Summary:
Timeframe Trend Demand Zone Type Zone (Proximal–Distal) Avg Price
Yearly UP BUFL 1720–1516 1618
Half-Yearly UP RBR 2724–1690 2207
Quarterly UP BUFL / RBR 2795–1690 2243
Monthly UP DMIP 2379–2193 2286
Weekly UP DMIP 2379–2193 2286
Daily UP DMIP 2264–2193 2229
60m / 180m / 240m UP DMIP/SOE ~2430–2380 range ~2400 avg
🔹 BALKRISHNA – Multi-Timeframe Trade Setup (Refined)
🔸 Trend Summary – All Timeframes: Strong Bullish
Timeframe Trend Demand Zone Type Zone (₹) Avg (₹)
Yearly UP BUFL 1720 – 1516 1618
Half-Yearly UP RBR 2724 – 1690 2207
Quarterly UP BUFL / RBR 2795 – 1690 2243
Monthly UP DMIP 2379 – 2193 2286
Weekly UP DMIP 2379 – 2193 2286
Daily UP DMIP 2264 – 2193 2229
Intraday (60/180/240m) UP SOE / DMIP 2383 – 2457 2400

Balkrishna , 1W Looking very Good pattern , and it is at Support level now
so the Risk is Very low . So Prefer to take the Trade at Low Risk Place
Risk according to your capital and risk capacity
if you missed at Support level wait for Clear Breakout to happen
then Enter , if you Missed After Breakout Avoid it completely
Follow For More Ideas like This

BALAKRISHNA IND LTD S/RSupport and Resistance Levels:
Support Levels: These are price points (green line/shade) where a downward trend may be halted due to a concentration of buying interest. Imagine them as a safety net where buyers step in, preventing further decline.
Resistance Levels: Conversely, resistance levels (red line/shade) are where upward trends might stall due to increased selling interest. They act like a ceiling where sellers come in to push prices down.
Breakouts:
Bullish Breakout: When the price moves above resistance, it often indicates strong buying interest and the potential for a continued uptrend. Traders may view this as a signal to buy or hold.
Bearish Breakout: When the price falls below support, it can signal strong selling interest and the potential for a continued downtrend. Traders might see this as a cue to sell or avoid buying.
20 EMA (Exponential Moving Average):
Above 20 EMA(50 EMA): If the stock price is above the 20 EMA, it suggests a potential uptrend or bullish momentum.
Below 20 EMA: If the stock price is below the 20 EMA, it indicates a potential downtrend or bearish momentum.
Trendline: A trendline is a straight line drawn on a chart to represent the general direction of a data point set.
Uptrend Line: Drawn by connecting the lows in an upward trend. Indicates that the price is moving higher over time. Acts as a support level, where prices tend to bounce upward.
Downtrend Line: Drawn by connecting the highs in a downward trend. Indicates that the price is moving lower over time. It acts as a resistance level, where prices tend to drop.
Disclaimer:
I am not a SEBI registered. The information provided here is for learning purposes only and should not be interpreted as financial advice. Consider the broader market context and consult with a qualified financial advisor before making investment decisions.

Balkrishna LongBalkrishna has formed Descending Triangle Pattern.. and now in consolidation mode.
Can give 8% and 17% in coming days.

#BALKRISHINDEarly Entry:
After the breakdown of a Rounding Pattern formed since Sept 21, It has shown renewed interest at the bottom of a channel both on the weekly with a hammer candle and a strong bullish bottom shaved engulfing on the daily! Entry above daily close of 2375. Morning Star at the bottom...
Safe Traders wait till Price closes above 200EMA or the Golden Crossover....

Balkrishan Ind. Ltd This script can be good for upcoming sessions, this is not an investment advise. One can keep an eye on this..

balkrisind bearish Bearish Marubozu - Hourly: 25 Oct 2024 02:15
Bearish Harami - Hourly 24 Oct 2024 03:30
technically looking bearish; also ceat and goodyear in a tailwind situation too;
2800 pe oct exp at 35-40rs probable

Analysis for Balkrishna Industries
We have a Fresh Supply formed in the left side which is a Source Supply and a Monthly Fresh Demand which is a Destination Demand.
Price has come into the Monthly Supply area, after reacting to the Monthly Supply, Price in Weekly chart has violated its previous low which confirms the downtrend and we have a freshly formed Weekly Supply to short into.
So we have a Weekly Supply with a 5 : 1

Balkrishna Ind.- Bullish swing
03.09.2024
Buy-2916
Target-3196
Stop Loss-2372
Risk Reward-1:1.5
1. Consolidation breakout
2. It has bounced from resistance turned to
support zone by creating double bottom
3.Volume- Good volume accumulation
4. 200 EMA Rejection. About to cross 21 & 50 EMA
5. Exact rejection at 0.5 Fibonacci level
6. RSI Entered to bullish zone from over sold level

Inside candle pattrn in daily chartBalkrisind is daily chart make is inside candl chart pattern focus on this stock

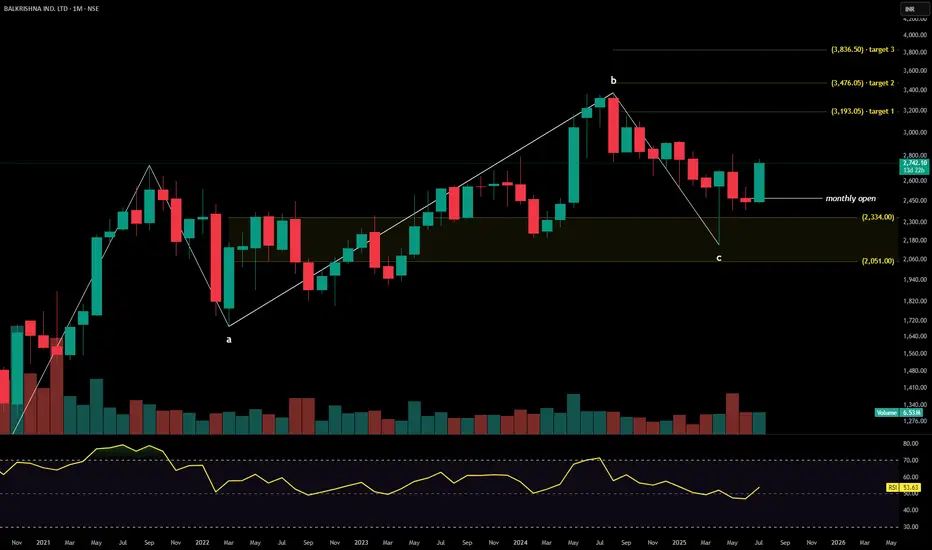
Balkrishna LongBalkrishna
Current Price :
Balkrishna Weekly Supply 3239
MTF Analysis
Balkrishna YearlyDemand Breakout 1720
Balkrishna 6 Month Demand Breakout 2723
Balkrishna Qtrly Demand Beakout 1875
Balkrishna Monthly Demand 2478
Balkrishna Weekly BUFL 2795
Balkrishna Weekly DMIP 2912
Balkrishna Daily DMIP 2812
ENTRY 2912
SL 2800
Target 3826
Last High 3369
RR 8.16

Balkrishna Industries 240 Min LONGThe stock may bounce from this level & Stop further downfall. Expecting at least 3:1 RR.

$NSE:BALKRISIND Bullish flag pattern on a weekly chartThe flag pattern is a powerful trend continuation pattern. It represents a brief consolidation after a strong price movement.
In this example of NSE:BALKRISIND ,
The stock rallied by 44%/~1000 in 8 weekly bars - 56 days
Currently, the price has broken out of the channel and is in the same direction as the initial trend of the chart.
It corrected 9% /~302 before breaking out.
Disc - invested, for educational purposes only.

buy at zone - swing / intradayENTRY
- lines marked below is potential reversal zone ( PRZ)
- entry is strictly inside the zone
- look for buying confirmation in smaller time frame ( 15 minutes preferred )
EXIT
1. target
- mark fib retracement from C to latest swing low
- TGT 1 - 0.236 fib level ( intraday tgt)
- TGT 2 - 0.382 fib level
- TGT 3 - 0.5 fib level ( preferred target )
2. SL
- candle close below (PRZ)
- if u didn't get confirmation inside the zone , ignore this pick
- if candle close is below zone , this pattern becomes invalid . IGNORE THIS PICK
- RE-ENTRY can be done , if u again get buying confirmation inside the zone

BALKRISHNA INDUSTRIES LOOKS BULLISH FOR THE TARGET OF 2700Balkrishna Industries Limited (BKT) started its Off-Highway tyre business in 1987. For over 30 years, BKT has successfully focused on specialist segments such as agricultural, construction, and industrial as well as earthmoving, port and mining, ATV, and gardening applications.
BKT is India’s Leading player in the Global ‘Off-Highway Tire (OHT)’ Market. The company sells its tyres in 160+ countries through its distribution network in Europe, America, and Australia. It received 46% of its sales from Europe, followed by India (22%), the Americas (20%) & the Rest of World (12%).
In coming days around 17 may 2024 company will announce their Q4 result which will estimate to come higher than previous quarter result.
After a small falling now on the chart their is also a bullish chart pattern formation on daily as well as weekly chart.
As we see in the chart there is an Cup & Handle pattern formation which tends to reversal on the chart.
Any close above 2475 on the weekly basis will move the stock for the upside rally till 2700 and further new high.
Support and stop loss below 2360 levels on a closing basis.

Descending triangle breakoutGood volume buildup in daily timeframe.
Descending triangle breakout and simultaneously breakout of 1st resistance with good volume.
Fundamental are good.
Net profit increased YOY.
CCC reduced.
FII and DII stake increased compare to last year.
NOTE: I do my analysis, do yours before trade.

go long - swing pick- this stock shows signficant delivery percentage value
- possible chances for accumulation
- may perform good in upcoming days
- this stock is picked after market close based on delivery qty data.
- follow this stock for next 5 days , if entry not triggered with in 5 days , ignore pick
- line marked in chart is the day it showed huge delivery percentage.i consider it as signal candle.i marked its high and low
entry
- go long with 1:1.5 RR
- take entry if 15min close crosses the line , ignore entry if it made gap ups
- i prefer entry with in 5 days , if not triggered ignore this pick
sl
- candle close below signal candle's low
target
- keep 1.5 times of sl.

BALAKRISHNA IDS S/R Support and Resistance Levels: In technical analysis, support and resistance levels are significant price levels where buying or selling interest tends to be strong. They are identified based on previous price levels where the price has shown a tendency to reverse or find support.
Support levels are represented by the green line and green shade, indicating areas where buying interest may emerge to prevent further price decline.
Resistance levels are represented by the red line and red shade, indicating areas where selling pressure may arise to prevent further price increases. Traders often consider these levels as potential buying or selling opportunities.
Breakouts: Breakouts occur when the price convincingly moves above a resistance level (red shade) or below a support level (green shade). A bullish breakout above resistance suggests the potential for further price increases, while a bearish breakout below support suggests the potential for further price declines. Traders pay attention to these breakout signals as they may indicate the start of a new trend or significant price movement.
20 EMA: The yellow line denotes 20 EMA, to interpret the 20 EMA, you need to compare it with the prevailing stock price. If the stock price is below the 20 EMA, it signals a possible downtrend. But if the stock price is above the 20 EMA, it signals a possible uptrend.
Disclosure: I am not SEBI registered. The information provided here is for learning purposes only and should not be interpreted as financial advice. It is important to consult with a qualified financial advisor before making any investment decisions. Tweets neither advice nor endorsement.

sell at zone ~ intradayexpecting small fall from the zone .
- good for intraday trade
expecting small fall from the zone . look for confirmation inside zone in smaller time frame
ENTRY
- entry is strictly inside the zone
- look for confirmation in smaller time frame ( 15 mins preferred )
TARGET
- use fibonacci retracement on C to latest swing high
- mark 0.236 fib value as target
STOPLOSS
- if daily tf candle close is above the zone .

Breakaway gap in Balkrishna Industries?The price of NSE: BALKRISIND did breakout from previous all time high and resistance zone with a gap. This could possibly be a breakaway gap with high volume.
The gap was tested this week and bulls held the breakout.
Looks like decent chances of continuation from here.
